(1)
where θ (x) is the Heaviside function. Variable w is the dead band to exclude temporal neighbors. We set P ref = 0.05, and w = 140. For the time delay embedding, we set τ = 10, d = 14. The association matrix is computed by using 5,000 sample points.
In this paper, we construct the brain graph using 43 channels covering the frontal lobe and parietal lobe, which play an important role in attention, memory, language, and other cognitive function. The value of the threshold was set under the criterion that ensures all brain graphs hold the same number of edges and can thus be easily compared between groups. In this way, the two groups of graphs hold the same number of vertexes and edges [2].
We consider brain networks as undirected and unweighted graphs. The clustering coefficient and the characteristic path length are two popular indexes for undirected unweighted graphs in small world network theory [5]. We use harmonic average path length as one kind of revised path length index in this study. The equations of clustering coefficient and harmonic average path length are given as follows:


where a ij is equal to 1 when vertexes i and j are connected, k i is the number of edges incident with i, d ij is the shortest path length between vertexes i and j, and d ij is infinity when i and j are isolated from each other.

(2)

(3)
3 Results and Discussion
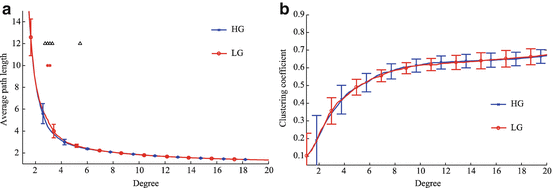
A comparison of the graph indexes between the high scoring group (HG) and low scoring group (LG) was performed. Figures 1, 2, and 3 show the means and standard deviations of the clustering coefficient and harmonic average path length as a function of the degree of graph. In the figures, the blue and red lines represent the HG and low LG, respectively. Triangles and asterisks indicate that the differences between groups were statistically significant (p < 0.05 and p < 0.01 in t-test, respectively).


