Figure 6.1. Scale of absorption of intensity of intracranial structures expressed in Hounsfield Units (HU).
In pathological situations, recent intracranial hematomas may absorb +70 HU or more due to their hypercellularity, the ferric component of hemoglobin, and the concentration of calcic elements. Therefore, the radiation absorption is high and shows up as a hyperdense image. In ischemic or edematous areas of the brain, these regions have a lower radiation absorptive capacity, with absorption of +20 HU or less. Therefore, the range of values of Hounsfield units that we should select to study intracranial physiological structures must be between 0 and +50 HU, including in this exam the cerebrospinal fluid, normal brain, or hypodense brain (as in brain damage of ischemic origin). If the diagnosis includes the possible presence of hemorrhagic lesions, the range of HU should be set between 0 and +100 HU. Within this range, hemorrhagic injuries can be observed as images with less radiological density than skull bone.
The range of HU values is called a “window.” In addition, the computer system enables the operator to decide which anatomical structure corresponds to the grey scale medium (between black and white; a scale of 40 levels of grey are easily perceptible to the human eye). If the operator decides that the medium average is a normal cerebral tissue (around +45 HU), the grey matter can be observed as a hyperdense image. Inversely, areas such as the white matter or injuries with larger water content, as in brain edema, can be observed as hypodense images.
Another relevant technical aspect of CT scanning is the orientation of the slice to the major axis of the body. Before selecting the slice orientation, we should establish the diagnostic suspicion and the potential intracranial location of the lesion. In general, the standard slice orientation for acute neurocritical patients should be the cantomeatal orientation, which follows an imaginary line from the external auditory channel to the eye. Other orientations such as the neuro-orbitary, the biauricular orientation, and the occipital-temporal orientation can also be useful in the diagnosis of other types of intracranial lesions in neurocritical patients.
A standard CT scan will include a scout view (simple X-ray image in a sagittal section) and a series of CT slices on the axial axis. In CT studies in critical emergencies, 4-8 mm thickness slices in the supratentorial region and 4 mm slices in the posterior fossa are advisable; however, intravenous contrast material should not be used unless brain abscess, isodense subdural hematoma or other lesions are suspected.
6.2 CT in Head-injured Patients
A significant advance in the diagnosis of consequences of head injury was the ability to scan and monitor intracranial pressure. In the early 1980s the usefulness of CT in head-injured patients was proved not only because of the efficacy of the CT scan to demonstrate the presence of hemorrhagic intracranial lesions amenable to surgical removal, but also its capacity to evidence other kinds of lesions with prognostic relevance.
The technical aspects of CT in patients with head injuries does not substantially differ from those of other neurological critical situations: a window between +90 HU and +100 HU; centre in +40 HU; cantomeatal orientation; 4-8 mm slices in the supratentorial region; and 4 mm slices in the infratentorial region, without the use of intravenous contrast material. A scout view of the cervical spine should be also included. A CT scan with a bone-like window must complete the radiological exam in order to diagnose the possible presence of injuries or cranial fractures. The frequent association of ffacial injuries with head injury, makes advisable a facial CT scan, including paranasal sinus.
There are several approaches to interpreting the CT scan of patients with head injury in the acute phase. The most widely used classification of CT scan findings in such patients is the Traumatic Coma Data Bank classification (TCDB) (Table 6.1). According to this scheme, injuries are categorized into two basic groups: 1) diffuse lesions, including low-volume intracranial space-occupying lesions and diffuse brain damage prevailing over the focal damage; 2) high-volume intracranial space-occupying lesions.
The first group comprises predominantly diffuse injuries or predominantly focal lesions without significant mass effect (known as diffuse brain injury) and is further subdivided into four categories. In high-volume focal lesions (volume >25 ml), mass effect can be due to purely hemorrhagic lesions or mixed density lesions. These injuries are grouped into two categories depending on whether they can be surgically removed or not.
Category | CT scan |
Diffuse injury I (no visible pathology) | No visible intracranial pathology seen |
Diffuse injury II | Cisterns present with midline shift 0-5 mm and/or lesion densities present; no high or mixed density lesion >25 ml; may include bone fragments and foreign bodies |
Diffuse injury III (swelling) | Cisterns compressed or absent with midline shift 0-5 mm; no high or mixed density lesion >25 ml |
Diffuse injury IV (midline shift) | Midline shift >5 mm, no high or mixed density lesion >25 ml |
Evacuated mass | Any lesion that can be surgically evacuated |
Non-evacuated mass | High or mixed density lesion >25 ml that cannot be surgically evacuated |
Table 6.1. Classification of CT findings according to the Traumatic Coma Data Bank classification.
The TCDB classification takes into account a direct relationship between four diagnostic categories of diffuse brain injury and the risk of death. Similarly, when the TCDB system is used together with the traditional classification of intracranial hemorrhages (epidural hematoma, subdural hematoma, intracerebral hematoma), the risk is higher if accompanied by intracranial hypertension. According to the TCDB’s designers there is a direct relationship between the Glasgow Coma Scale (GCS) score (mainly its motor component) and categorization according to the TCDB classification. The TCDB authors admit that the scheme’s categories are arbitrary; however, they underline the high prognostic value of the four groups of diffuse brain injury the classification distinguishes (Table 6.1):
- CT scan normal for age and previous health status (diffuse brain injury I).
- Pathological CT scan with mixed or low-volume hypodense lesions (<25 ml) without compression of the cisterns or significant midline shift (0-5 mm) (diffuse brain injury II).
- CT scan with or without injuries similar to diffuse brain injury type II but in which there is compression or absence of the cisterns (diffuse brain injury type III or diffuse injury with cerebral swelling).
- Pathological CT scan with mixed or low-volume hypodense lesions (<25 ml) but with midline shift >5 mm (diffuse brain injury IV or diffuse brain injury with midline shift).
The TCDB classification has been criticized for its fundamentally surgical orientation, omitting in the analysis of the CT scan some injuries that cannot be surgically treated but with a known impact on prognosis.
In the TCDB classification, diffuse axonal injuries localized mainly next to the midline are considered as small-volume hemispheric injuries, in spite of the differences in clinical prognosis. Similarly, brainstem injuries (of significant relevance for prognosis) are not included. Nevertheless, the TCDB classification is universally accepted and has become a standard reference for CT evaluation of traumatic brain injury. On the other hand, one of the advantages of the TCBD classification is its high level of interobserver agreement, where the degree of concordance in mass lesions (concordance, 0,94-0,91) is higher than in diffuse brain injury (categories I-IV) (concordance, 0,71-0,67).
Some of the limitations of implementing the TCDB classification have been overcome in daily clinical practice. Traumatic subarachnoid hemorrhage, which has a recognized impact on prognosis, is included among type II lesions; and significant brainstem injuries are considered as unclassifiable injuries in the TCDB system.
When using the TCDB scheme it is advisable not to classify mass injuries in numeric expressions as in diffuse lesions, which definitely fall under diffuse brain injuries I-IV. High-volume mass injuries do not have a numerical categorization.
It should also be remembered that the TCDB system is a dynamic classification and can therefore vary in each patient depending on the clinical course. Accordingly, if the volume of a diffuse brain injury type II increases, it should be reclassified as a mass injury (evacuated or not evacuated).
In patients with head injury, interpretation of the CT scan should be extended beyond categorization by the TCDB scheme to include other levels of analysis. From a pathophysiological perspective, study of the CT scan of a head-injured patient should include the search for the presence or absence of anatomic structures. This first exam should include a revision of normal cerebral structures and the normal location and amount of cerebrospinal fluid. Only thereafter should the analysis of pathological images start. Table 6.2 illustrates a systematic protocol for interpreting pathological lesions on the CT scan. The protocol includes the following lesions: 1) high-volume hemorrhagic injuries and, therefore, potentially surgically evacuable lesions; 2) hypodense lesions of different cause (hypodensities of vascular distribution, simple contusions, etc.); 3) single or multiple injuries, frequently of low volume and usually associated with diffuse axonal injury.
This step in the description of lesions on the CT scan must be followed by a second step in which the presence or absence of pathophysiological conditions frequently associated with head injury (e.g., intracranial hypertension, cerebral herniation or others) must be inferred.
Hemorrhagic injuries that are potentially surgically removable |
|
Hypodense space-occupying injuries |
|
Lesions frequently correlated with axonal injury |
|
Table 6.2. Initial data to analyze on the CT scan of head-injured patients.
6.2.1 Potentially Removable Hemorrhagic Lesions
There are several types of hemorrhagic injuries consequent to head injury, each of which with different clinical and prognostic meanings. Hyperdense lesions, as an extra element in the intracranial content, have been frequently associated with space-occupying mass lesions, and intracranial hypertension by analogy to neoplasms. Often, the increased volume accompanying such lesions after head trauma will lead to intracranial hypertension. Another point to consider is that the presence of such a lesion is a marker for the presence of other lesions, less eloquent on the CT scan but with relevant prognostic significance. Table 6.3 lists hemorrhagic injuries commonly detected in the CT scan of head-injured patients.
|
Table 6.3. Most frequent hemorrhagic injuries after traumatic brain injury.
6.2.2 Epidural Hematoma
Epidural hematoma is an extra-axial hemorrhage in the external region of the dura mater. It carries two main risks: it can evolve into a rapid-growing intracranial lesion and it may reach a very high volume. Subsequently, epidural hematoma carries a high risk of intracranial hypertension, with the consequent risk of compression of cerebral structures of clinical (mesencephalon, brainstem) and functional importance. At attenuation values of approximately 50-100 HU, the morphology of an epidural hematoma is typically a biconvex lens (Figure 6.2), generally with clear-cut borders and usually adjacent to a fracture line. The density is frequently homogenous. Usually unilateral, it can increase substantially in volume, compressing the ipsilateral ventricle and shifting the septum pellucidum significantly.
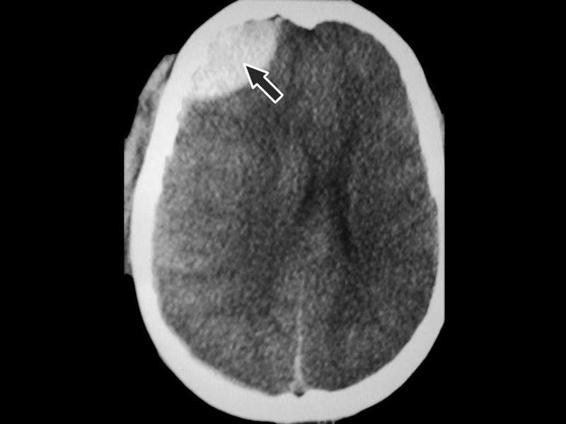
Figure 6.2. Frontal epidural hematoma. Morphology of biconvex lens (black arrow). Midline shift.
The presence of a heterogeneous epidural hematoma suggests active bleeding. The most frequent location is the temporoparietal region (75% of epidural supratentorial hematomas occur next to the temporal bone). In most cases, epidural hematoma results from damage of the meningeal arteries. Less frequent localizations are the frontal and occipital regions (8 and 5% of all epidural hematomas, respectively). Posterior fossa epidural hematomas have a higher incidence than subdural or vertex hematomas and suggest damage to the sagittal venous sinus or lateral venous sinus.
Besides morphology, other data can aid in the differential diagnosis between epidural hematoma and subdural hematoma. If a hematoma crosses major sutures of the skull and extends to both sides of the tentorium, the probability of an epidural location of the hematoma is higher than subdural. The coexistence of ipsilateral epidural and subdural hematomas is not uncommonly associated with epidural hematoma; however, much more frequent is epidural hematoma and contralateral subdural hematoma, which results from blow and counterblow injuries.
In most cases, epidural hematoma is the only intracranial lesion observed after traumatic brain injury. Its association with significant intra-axial lesions is less than 15%. Prompt surgical evacuation of epidural hematoma is normally associated with good prognosis. Irrespective of the surgical delay in this type of injury, a correlation exists between delay and increased mortality. Similarly, epidural hematomas >2 cm, with areas of different densities (suggestive of active bleeding) and midline shift are usually associated with poor outcome unless promptly removed.
6.2.3 Subdural Hematoma
Subdural hematoma may be considered similar to epidural hematoma because it arises in adjacent anatomical structures; however, it carries a different prognosis and pathogenetic meaning. There are small superficial cerebral veins that flow toward the large venous sinuses, crossing the subarachnoid and the subdural spaces. These veins are relatively straight lines and very susceptible to rotation, deceleration and traction motions that occur in traumatic brain injury. Tearing of bridging veins is the most common cause of hematoma in the subdural space. This virtual space is only evident due to the mechanism of increased pressure that allows it to be revealed. A less frequent mechanism of subdural hematoma is cerebral contusion adjacent to the subdural space, with bleeding into the subarachnoid-pia mater space.
Occasionally, subdural hematomas can be observed after rupture of a large intracerebral hematoma in the subdural space. Although a subdural hematoma can arise in the cranial region that has been directly hit, it is more commonly found in the counterblow regions. Typically, the morphology of subdural hematoma on a CT scan is a hyperdense lesion next to the bone, with a lens convergent-shaped opacity of homogenous density; at high attenuation it appears on the CT scan with less neat borders than an epidural hematoma. Acute subdural hematomas (Figure 6.3) are more frequently located at a brain convexity, mainly in the parietal region and less frequently in the frontal lobe and occipital area. Sometimes, subdural hematomas can be difficult to identify on the CT scan due to subjacent cranial bone. In order to minimize this effect, the signal amplitude and the CT scan window need to be adjusted to better identify the injury.
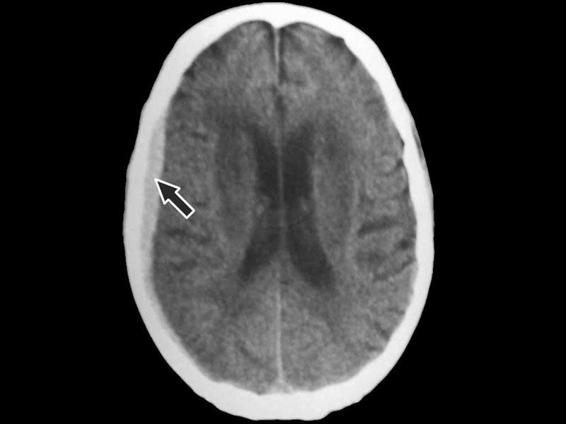
Figure 6.3. Extensive right parieto-occipital subdural hematoma. Typical morphology (black arrow). No midline shift.
The second most frequent location of subdural hematoma is the tentorium, evidenced as an asymmetry in the typical “Y” morphology of the tentorium surrounding the vermis. Less frequent is an interhemispheric location (due to laceration of the veins draining into the sagittal sinus). Interhemispheric subdural hematomas are frequently associated with coagulopathy or platelet dysfunction. It is not unusual to observe acute subdural hematomas of atypical morphology. Sometimes, acute subdural hematomas of heterogeneous density, with a mixture of low and high attenuation areas, suggest active bleeding or a subarachnoid leak into the subdural space. Frequently, hyperacute subdural hematomas do not present a morphology typical of subdural hematoma, but a lens-shaped form instead. Although the exact mechanism underlying this morphology is unclear, intense bleeding (minutes after the accident) and blockage of the subdural space due to arachnoid adherences are thought to be involved. One characteristic of acute traumatic subdural hematoma is its frequent association with other intracranial lesions.
Posttraumatic acute subdural hematoma is seldom an isolated lesion. Like single traumatic intracranial lesions, posttraumatic acute subdural hematomas are not usually associated with relevant trauma, anticoagulant or anti-platelet aggregation therapy. In more than 80% of traumatic injuries, subdural hematomas and intracerebral lesions are adjacent, the latter sometimes involved in the genesis of the subdural hematoma. This is one of the reasons why traumatic subdural hematomas have a worse prognosis than epidural hematomas. The poor prognosis of subdural hematoma is mainly due to two factors: mass effect (surgical evacuation in the first 4 hours after trauma carries a better prognosis); and its association with other intracranial lesions that result in compression of the lateral ventricles, midline shift, and intracranial hypertension among others.
6.2.4 Cerebral Contusion and Cerebral Hematoma
Cerebral contusion is the second most frequent intracranial lesion after head trauma. Cerebral contusion can be defined as a cerebral lesion due to a direct blow to the head. CT scans of cerebral contusions show images of a mixture of hypo- and hyperdensities due to dispersed multiple petechial injuries in the damaged area, associated with areas of edema and/or tissue necrosis (Figure 6.4). Depending on its location and the mechanism of injury, cerebral contusions can be classified into different groups. When the contusion results from the direct effect of bone impact on the brain, the contusion underlies the bone. Cerebral contusions resulting from counterblow may be located in the contralateral region of impact. The precise mechanism of injury is not clear; however, the gradients of negative pressure generated during the blow may play an important role.
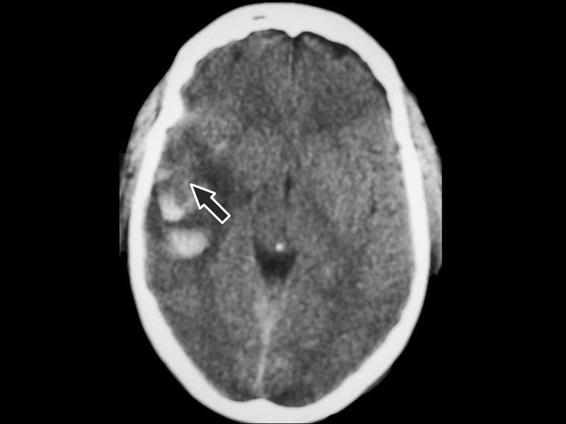
Figure 6.4. Image of mixed contusion in the right temporal lobe (black arrow).
Although cerebral contusions can occur in any part of the brain, the regions most often affected in traumatic brain injury are the inferior areas of the frontal and the temporal lobes. This is probably due to the regions sliding over the surface of the anterior and temporal fossa during sudden acceleration/deceleration accompanying the trauma. The regions most often involved are the brain areas subjacent to bones (inferior frontal bone, petrosal crest, etc.). The parasagittal region is also frequently damaged, whereas the cerebellum and occipital areas are less often affected.
Intracerebral hematoma is seen on the CT scan as a hyperdense intracerebral area with sharp borders at an attenuation between +70 and +90 HU. If an intracerebral hematoma is observed on the CT scan, it has to be >25 ml in volume to be included in the TCDB classification as a significant mass lesion. This value is arbitrary and probably reflects more a distinction of surgical relevance rather than a neuroanatomical difference. The CT scan can show key characteristics of an intraparenchymal cerebral hematoma to aid in deciding whether to remove the hematoma. Besides volume, tomographic data need to be taken into consideration in hematoma removal. A midline shift of >7 mm is a relevant element to support the decision for surgical removal. The location of cerebral contusions is also important when establishing the indication for surgery. Voluminous hemorrhagic contusions in the temporal lobe compressing the basal cisterns, even without midline shifting, correlate with sudden deterioration in consciousness. Therefore, this kind of cerebral contusion must also be considered as potentially surgically removable.
6.2.5 Increase in Cerebral Volume After Traumatic Brain Injury
Increased cerebral volume due to either brain edema or a rise in cerebral blood volume causes the cerebrospinal fluid (CSF) to move out of the skull toward the spinal spaces. On the CT scan the increase in cerebral volume is mainly shown by the absence of CSF in its usual position. Absent or decreased CSF on the CT scan may not only be due to brain edema but it can be also associated with an intracranial increase of the intravascular compartment, which frequently occurs in posttraumatic cerebral hyperemia.
For the tomographic diagnosis of an increase in cerebral volume, the following data are relevant: absence or decrease in the size of the ambiens cistern, absence or decrease in the size of the third ventricle, absence or decrease in the size of the lateral ventricles, absence of perihemispheric CSF (Figures 6.5 and 6.6), and/or decrease in the size of the cistern of the great cerebral vein of Galen.
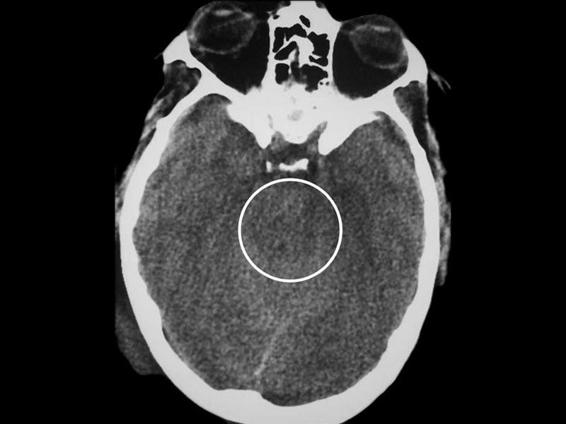
Figure 6.5. Image suggesting intracranial hypertension (black circle), with absence of the ambiens cistern.
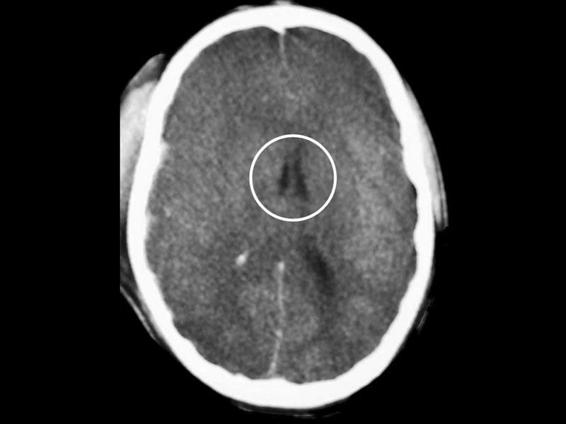
Figure 6.6. Generalized increase in cerebral volume. Absence of the cerebral sulci. Decrease in the size of the lateral ventricles (black circle).
Some practical aspects should be considered before evaluating the absence of CSF as a clue to increased cerebral volume. When estimating the size of the lateral ventricles, the patient’s age should always be taken into account: CSF volume is lower in the lateral ventricles of young patients. The absence of perihemispheric CSF is a sensitive finding to establish the suspicion of increased cerebral blood volume; however, this high sensitivity is accompanied by a low specificity because the cerebrospinal spaces can be reduced by hypoventilation and/or other mechanisms that will transiently increase cerebral blood volume.
In contrast, the decrease or absence of the basal cisterns and a decrease in the size of the third ventricle (specifically defined as a relevant element suggestive of type III injury in the TCDB classification) are the most specific indicators of an increase in cerebral volume due to a pathological mechanism. Analysis of the cistern of the internal cerebral vein deserves special mention, as it is often present even in patients with intracranial hypertension and cerebral herniation. Its absence is highly suggestive of large supratentorial masses not always clearly visible on the CT scan, like subdural hematomas close to the vertex.
6.2.6 Injuries Compatible With Diffuse Axonal Injury
The term diffuse axonal injury was coined by S.J. Strich in 1956 to describe a series of injuries, usually of small volume, subsequent to head injury and sometimes associated with severe neurological dysfunction and occasionally irreversible. Some authors hold that there is a certain degree of axonal injury in all severely head-injured patients. The predominant locations of diffuse axonal injury are: the parasagittal white matter close to the grey matter; the corpus callosum; the pontine-mesencephalic union; and the cerebellar peduncles. In white matter damage, the most frequent location is the frontal region and periventricular regions of the temporal lobes, normally next to the temporal horn of the lateral ventricle.
Adams classifies axonal diffuse injury into three grades of severity: mild, moderate and severe. In this classification scheme, mild injury (grade I) is characterized by microscopic changes in the white matter of the cerebral cortex, the corpus callosum, the brainstem and occasionally the cerebellum. Moderate diffuse axonal injury (grade II) is defined as the presence of evident focal changes in the corpus callosum. Severe axonal diffuse injury (grade III) comprises grade II lesions plus injuries in the dorsolateral region of the brainstem, usually in the superior cerebellar peduncles.
Table 6.4 shows the modified Gennarelli’s classification system. Gennarelli’s classification is based on anatomical findings; however, it is the basis for radiological approaches to the classification of diffuse axonal injury. In addition to the elements included in Gennarelli’s classification, injuries in the anterior commissure, the septum pellucidum and the fornix are frequently associated with corpus callosum lesions.
Degree | Description |
I | Evidence of axonal injury consisting of small lesions in the white matter of the cerebral hemispheres, the corpus callosum, the brain stem and, occasionally, the cerebellum |
II | Focal macroscopic lesions in the inferior part of the corpus callosum, sometimes on one side of the midline but extending over several centimetres rostrocaudal, and in the white matter of the cerebral hemispheres |
III | I and II degree lesions may be present, as well as evidence of hemorrhagic focal injuries in a dorsal lateral quadrant of the mesencephalon or the superior third part of the protuberance |
Table 6.4. Morphologic classification of diffuse axonal injury based on Gennarelli’s classification.
The principal mechanism involved in diffuse axonal injury is the shearing of the axonal structures or the stretching of these regions in which axons are predominant. Diffuse axonal injury is generated by rotation and acceleration/deceleration movements of the skull, which stretch and break the nerve fibers. It is accepted that the severity of diffuse axonal injury is higher after oblique and lateral impacts of the head than after a sagittal impact.
CT is not the best radiological technique for the diagnosis of diffuse axonal injury. Often, small hypodense lesions will not show up on a CT scan because the lesions present an attenuation indistinguishable from normal cerebral tissue. Nevertheless, the CT scan can be useful to suspect the existence of diffuse axonal injury as much for radiological direct signs as indirect signs. The CT scan can more easily reveal diffuse axonal injuries with hemorrhagic components, and it is less sensitive in the diagnosis when radiological hypodensity predominates. Since most axonal diffuse injuries are small lesions and less than 30% of them are hemorrhagic, CT is not the best method for their diagnosis.
The most frequent locations of diffuse axonal injury are the lobar white matter, the corpus callosum, and the brainstem. The junction between the grey matter and the white lobar matter, because of the abrupt change in tissue density, is the zone where axonal diffuse injuries are most frequently observed. They appear as small ovoid lesions with their major axis directed towards the axon affected. This type of injury has a certain predilection for the parasagittal region.
The area with the second highest incidence of axonal diffuse injury is the corpus callosum and the splenius zone in particular. The two hypotheses that reasonably explain this localization are: 1). The direct impact of the falx cerebri on the corpus callosum; 2). The rotational forces transmitted to the corpus callosum.
Diffuse axonal injury in the corpus callosum most often appears as a focal lesion, midline placed, frequently situated on the splenius and less often in the body or the genu of the corpus callosum. Occasionally, it is accompanied by intraventricular bleeding due to rupture of subependymal veins.
Diffuse axonal injury can be accurately diagnosed using magnetic resonance instead of CT. Magnetic resonance is sensitive enough to detect hemorrhagic and non-hemorrhagic lesions; however, several sequences are necessary to obtain a precise diagnosis.
Brainstem lesions, the most severe axonal diffuse injuries, are usually associated with multiple hemorrhages in the white matter and the corpus callosum. For this reason, they are considered sensitive indicators of axonal diffuse injury. The most frequent location of diffuse axonal injury in the brainstem is the dorsolateral region of the mesencephalon, although it is sometimes difficult on a CT scan to differentiate between the mesencephalon and the perimesencephalon) (Figures 6.7 and 6.8). Also frequent are injuries in the posterior limb of the internal capsule due to small lacerations of the lenticulostriate arteries that irrigate this zone. Less frequent injuries are those of the lenticular nucleus, the external capsula and/or the thalamus.
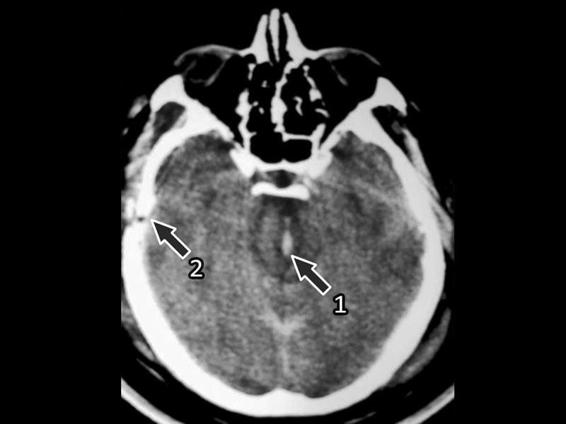
Figure 6.7. Brainstem injury (1) with secondary intracranial hypertension that generated distortion of the perforating arteries. Increase in volume of both temporal lobes and temporal fracture (2).
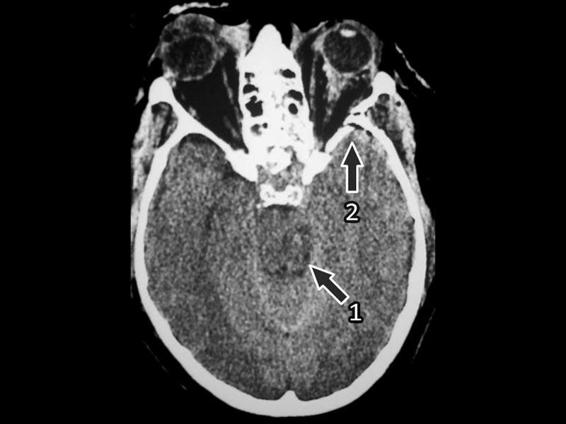
Figure 6.8. Small hematoma in the mesencephalon.
1 = Hematoma; 2 = Fracture with small subdural hematoma in the right temporal lobe.
In patients with axonal diffuse injury, there are other radiological signs that, although not strictly injuries of the cerebral parenchyma, are usually associated with axonal damage. Among these, intraventricular hemorrhage and subarachnoid hemorrhage should be mentioned. Intraventricular hemorrhage is often produced by blood coming from a cerebral hematoma into the intraventricular space and less frequently due to laceration of the subependymal veins. The clinical picture of this injury depends on concomitant injuries and/or the presence of hydrocephalus.
Posttraumatic subarachnoid hemorrhage appears on the CT scan as a hyperdense area of irregular distribution that spreads out around the cerebral hemispheres and into the cistern spaces; it can be caused by blow and counterblow injuries and can be observed in sites distant to the area of impact. Typical locations are the interpeduncularis cistern and the sulcus lateralis (fissure of Sylvius), often without generating mass effect. The clinical picture of posttraumatic subarachnoid hemorrhage is related to the risk of vasospasm and the symptoms arising from concomitant injuries. Traumatic subarachnoid hemorrhage has been demonstrated to be an independent factor for poor prognosis after traumatic brain injury. The coexistence of these lesions on a CT scan is associated with very poor outcome.
Diffuse axonal damage, because it produces defects in intrahemispheric and interhemispheric communication, is one of the most clinically relevant findings in the prognosis of head-injured patients. In general, complete recovery varies individually. Nevertheless, an inverse relationship has been observed between the Glasgow Coma Scale (GCS) score at admission and the Glasgow Outcome Scale (GOS), with a worse functional outcome for patients with brainstem injuries.
6.3 CT in Patients With Cerebrovascular Hemorrhagic Disease
6.3.1 Spontaneous Subarachnoid Hemorrhage
Spontaneous subarachnoid hemorrhage is a hemorrhagic cerebral disease that can be easily diagnosed at CT. The present generation of scanners can establish a diagnosis of intracranial subarachnoid hemorrhage in almost 100% of cases. The absence of subarachnoid blood on a CT scan, associated with bleeding demonstrated by lumbar puncture, correlates with low hematocrit (<23%), in which bleeding can be principally isodense. Where CT cannot be diagnostic for subarachnoid hemorrhage is in patients with severe coagulopathy or in those under anticoagulation therapy.
Similarly, subarachnoid hemorrhage detected by lumbar puncture without evidence of blood on the CT scan should prompt us to suspect subarachnoid hemorrhage due to extra-cranial bleeding (arteriovenous spinal malformation, etc.). It is also possible that blood not appearing in the subarachnoid space on the CT scan could be due to the occurrence of bleeding several days before; nevertheless, blood in the subarachnoid space can be detected on the CT scan even at the end of the first week after bleeding in almost 50% of cases.
Within days after the hemorrhage, the blood in the subarachnoid space decreases and the subarachnoid hemorrhage observed on the CT scan becomes isodense in relation to the parenchyma, which appears as a false image of obliteration of the cortical subarachnoid spaces and basal cisterns, simulating diffuse brain edema and suggesting an increase in intracranial pressure.
Magnetic resonance imaging (MRI) is more sensitive than CT to detect small subarachnoid hemorrhages in the subarachnoid spaces. An additional advantage is MRI’s ability to identify small calcifications sometimes associated with vascular disease.
One of the classic classification systems for the evaluation of spontaneous subarachnoid hemorrhage according to CT scan findings is Fisher’s classification (Table 6.5). Fisher designed this system to predict the development of vasospasm according to four risk categories from lowest to highest as follows: 1) no subarachnoid hemorrhage; 2) diffuse bleeding or a thin blood layer in the vertical subarachnoid structures <1 mm thick; 3) localized clots and/or vertical layers of blood in the subarachnoid vertical structures >1 mm thick; 4) diffuse bleeding or absence of subarachnoid blood but with intracerebral clots or intraventricular hemorrhage.
Degree | Characteristics |
1 | No bleeding on the CT scan |
2 | Diffuse bleeding or thin blood layer in any one of the vertical subarachnoid structures (intercerebral fissure, insular cistern, cistern ambiens) <1 mm thick |
3 | Localized clots and/or vertical layers of blood in the subarachnoid vertical structures ≥1 mm thick |
4 | Diffuse bleeding or absence of subarachnoid blood, but with intracerebral or intraventricular clots |
Table 6.5. Fisher’s scale.
According to Fischer’s classification, the presence of blood should be checked in at least the following locations: 1) frontal intercerebral fissure, including the region next to the genu of corpus callosum; 2) basal frontal fissure, including the inferomedial region of the hemisphere next to the region of the anterior communicating artery; 3) parieto-occipital fissure (posterior intercerebral fissure); 4) base of the sylvian fissure, (horizontal portion of the sylvian fissure around the proximal part of the middle cerebral artery and its bifurcation); 5) sylvian cistern (inferior part of the sylvian fissure adjacent to the middle cerebral artery); 6) insular cistern (subarachnoid space guided vertically on the surface of the insula); 7) sylvian fissure (part of the sylvian fissure superior to the surface of the temporal lobe); 8) suprasellar cistern (Circle of Willis region); 9) ambiens cistern (perimesencephalic space vertically guided); 10) quadrigeminal cistern (subarachnoid space adjacent to the quadrigeminal bodies); 11) cerebral transverse fissure between the corpus callosum, fornix and diencephalon; 12) prepontine cistern ventral to the base of the protuberance; 13) cerebellar superior cistern on the surface of the brain.
Grade | Characteristics |
0 | No subarachnoid hemorrhage or intraventricular hemorrhage |
1 | Minimal/thin subarachnoid hemorrhage, no intraventricular hemorrhage in both lateral ventricles |
2 | Minimal/thin subarachnoid hemorrhage, with intraventricular hemorrhage in both lateral ventricles |
3 | Thick subarachnoid hemorrhage, no intraventricular hemorrhage in both lateral ventricles |
4 | Thick subarachnoid hemorrhage, with intraventricular hemorrhage in both lateral ventricles |
Table 6.6. Revised Fisher’s scale.
Fisher’s classification was derived from a study that had limitations which aroused objections, including: 1) it did not involve a consecutive series of patients, which can be inferred from the high incidence of vasospasm in the series; 2) the high rate of patients grouped in risk category I probably due to the scanner generation in use at that time; 3) the inclusion of patients within 1-5 days after clinical signs of bleeding, which probably facilitated the clearance of blood in the subarachnoid space and therefore on the CT scan.
A later modified Fisher’s Scale (Table 6.6) incorporated elements known to influence the etiology of cerebral ischemia. These elements quantify the intensity of subarachnoid hemorrhage (including the impact of intraventricular hemorrhage on prognosis). Their relevance for prognosis in the prediction of neurological deficits after subarachnoid hemorrhage has been also tested.
The magnitude of blood on the CT scan after a subarachnoid hemorrhage is a general indicator of the severity of the clinical process (Figures 6.9 and 6.10).
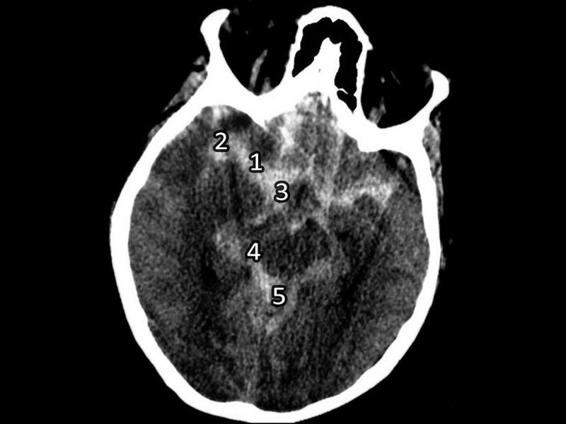
Figure 6.9. Spontaneous subarachnoid hemorrhage with bleeding in the sylvian fissure.
1 = Trunk; 2 = Sylvian fissure (lateral); 3 = Suprasellar cistern; 4 = Ambiens cistern; 5 = Quadrigeminal cistern.
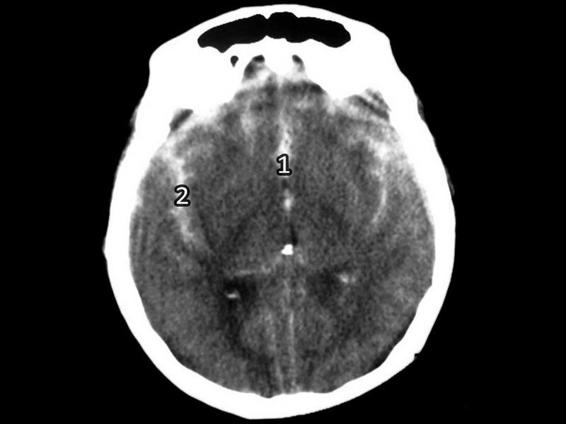
Figure 6.10. Spontaneous subarachnoid hemorrhage with bleeding.
1 = Intercerebral fissure; 2 = Sylvian fissure (lateral).
Patients with subarachnoid hemorrhage with relevant bleeding on a CT scan have a worse outcome. In fact, Fisher’s classification seeks to establish a direct relationship between the amount of bleeding visible on the CT scan and the risk of vasospasm over the following days.
Estimating the exact amount of blood in the subarachnoid space on a CT scan is not easy because of: 1) irregular distribution of cisterns and fissures; 2) CT cross-sections do not correspond to the anatomical distribution of the subarachnoid spaces; 3) different amounts of blood in the subarachnoid regions; 4) inaccuracy in the measurement of the intensity in HU or the frequent coexistence of the partial volume effect; 5) progressive tendency to isodensity of bleeding over time.
To quantify the intensity of the bleeding in the basal cisterns in patients with subarachnoid hemorrhage, Hijdra et al. developed a quantitative system that could be used to score the extent of bleeding in 10 subarachnoid spaces close to the circle of Willis. Blood should be quantified in the following spaces: frontal intercerebral fissure; lateral sylvian fissures; basal sylvian fissures; suprasellar cistern (bilateral quantification); ambiens cistern (bilateral quantification); and quadrigeminal cistern. Bleeding intensity is scored as follows: no blood in the subarachnoid space (0); small quantity of blood (1); moderate quantity (2); a subarachnoid space completely filled with blood (3).
The range of the intensity of a subarachnoid hemorrhage is between 1 and 30 points on this scale. The location of bleeding on a CT scan in subarachnoid hemorrhage can aid in detecting an aneurysm in the circle of Willis. In a bleeding aneurysm of the anterior communicating artery, the hyperdensity is usually located in the suprasellar cistern and the frontal intercerebral fissure, with spread to the frontal regions and less frequently to the pericallosal cistern and the sylvian fissure. In severe bleeding of the anterior communicating artery, intracerebral hematomas in the frontobasal regions are frequently observed. A bleeding internal carotid artery aneurysm in the supraclinoid segment shows a variety of locations of blood on the CT scan, including: the suprasellar cistern; the interpeduncularis cistern; the sylvian fissure; and the anterior intercerebral fissure. In middle cerebral artery bleeding, the most frequent locations of blood are the sylvian fissure and the suprasellar cistern. Intracerebral hematomas in the parasylvian areas are also common in sylvian aneurysms. Hemorrhage due to an aneurysm of the distal segments of the basilar artery often evidences blood in the suprasellar cistern, the perimesencephalic cistern, and the interpeduncular cistern, while in bleeding aneurysms of the posteroinferior cerebellar artery, blood is typically revealed in the prepontine and the pericerebellar cistern.
6.3.2 CT in the Diagnosis of Intraventricular Hemorrhage
Intraventricular hemorrhage is a frequent finding after a subarachnoid hemorrhage. The higher incidence of intraventricular bleeding after an aneurysm rupture is associated with an aneurysm of the anterior communicating artery in which the lateral ventricles and the third and fourth ventricles are flooded with blood. This type of bleeding is also frequent in rupture of carotid aneurysms and sylvian aneurysms. In subarachnoid hemorrhage due to an aneurysm of the posteroinferior cerebellar artery, the bleeding often affects the third and fourth ventricles, without extension to the lateral ventricles. The increase in resistance to the physiological circulation of CSF due to ventricular bleeding and altered fluid reabsorption frequently correlates with hydrocephalus.
Severe spontaneous intracerebral hemorrhage is also frequently associated with ventricular bleeding. The incidence of intraventricular hemorrhage is higher in thalamic hematoma or in putamina hematoma with thalamic extension. In interventricular hemorrhage associated with brain injury, the incidence is lower than in cerebrovascular hemorrhagic disease. Traumatic intraventricular hemorrhage is often associated with mechanisms of acceleration/deceleration that frequently cause diffuse axonal injury and is often due to rupture of the subependymal veins.
In 1982, Graeb et al. reported on the relevance of interventricular bleeding in acute neurological patients and developed a classification scheme to quantify intraventricular bleeding in patients with cerebrovascular disease and head trauma. Because of the high incidence of intraventricular bleeding in subarachnoid hemorrhage and spontaneous intracerebral hemorrhage, Graeb’s classification is chiefly used in patients with spontaneous intracranial hemorrhagic. Table 6.7 illustrates the scoring system according to CT scan findings.
Site | Characteristics | Score |
Right lateral ventricle | Trace of blood or mild bleeding | 1 |
Less than half of the ventricle filled with blood | 2 | |
More than half of the ventricle filled with blood | 3 | |
Ventricle filled with blood and expanded | 4 | |
Right lateral ventricle | Trace of blood or mild bleeding | 1 |
Less than half of the ventricle filled with blood | 2 | |
More than half of the ventricle filled with blood | 3 | |
Ventricle filled with blood and expanded | 4 | |
Third ventricle | Blood present, ventricle size normal | 1 |
Ventricle filled with blood and expanded | 2 | |
Fourth ventricle | Blood present, ventricle size normal | 1 |
Ventricle filled with blood and expanded | 2 |
Table 6.7. Graeb’s scale. Each lateral ventricle is scored separately. The maximum score is 12 points.
The maximum score is assigned for blood flooding the lateral ventricles, including also the presence of blood in the third and fourth ventricles. It is important to emphasize that “ventricles full of blood and expanded” indicates the presence of a ventricular dilatation directly attributable to bleeding and not to the possible coexistence of hydrocephalus. The maximum score is 12 points. There is general consensus that a score >7 implies intraventricular bleeding associated with clinical severity.
A similar scale described by Le Roux et al., although initially used to assess ventricular hemorrhage associated with traumatic brain injury, has been frequently used to evaluate intraventricular hemorrhages due to spontaneous subarachnoid hemorrhage. Le Roux’s scale quantifies between 1 (minimal quantity of blood) and 4 (completely full ventricle) the invasion by blood into the third, fourth and each of the lateral ventricles. The score range on the Le Roux scale is 1-16 points.
6.3.3 CT in Spontaneous Intracerebral Hematoma
Compared with normal parenchyma, spontaneous intracerebral hematoma appears on the CT scan as a hyperdense area inside the cerebral parenchyma, usually generating mass effect. The hyperdensity is due to the presence of hemoglobin (90%) and only partially to the iron concentration (8%). Clot retraction causes a substantial increase in blood cell volume and therefore an increase in radiological density (+90-100 HU). Generally, small-volume intracerebral hematomas present with a rounded or oval shape, with relatively neat borders, whereas high-volume hematomas show irregular and indistinct borders, as well as asymmetric morphology. In 88% of cases, spontaneous intracerebral hemorrhage occurs inside the cerebral hemispheres, 8% in the cerebellum, and 4% in the brainstem.
The precise location of intracerebral hematoma on the CT scan is relevant to determine:
Stay updated, free articles. Join our Telegram channel

Full access? Get Clinical Tree


