Fig. 6.1
Synthesis of findings from existing studies of cortical thickness differences between children and adolescents with ASD and TD, integrated using a sulco-gyral-based parcellation. The red and blue ROIs represent regions for which cortex was thicker and thinner, respectively, in the ASD group. Color scale represents the number of times each region has been reported in reviewed literature. 1 middle frontal gyrus, 2 inferior frontal sulcus, 3 triangular part of the inferior frontal gyrus, 4 precentralgyrus, 5 paracentral sulcus, 6 superior frontal gyrus, 7 orbitofrontal gyrus, 8 superior parietal lobule, 9 precuneus, 10 supramarginalgyrus, 11 superior temporal sulcus, 12 middle temporal gyrus, 13 inferior temporal gyrus, and 14 fusiform gyrus
These findings suggest that abnormal patterns of cortical thickness in a broader network of cortical areas subserving social cognition, communication, and repetitive behaviors, could be underlying the core features of autism. However, this effect appears to be dynamically age-dependent, as the most pronounced period of cortical enlargement occurs in early postnatal periods (Hazlett et al. 2011; Courchesne et al. 2001, Schumann et al. 2010) , while adults with ASD tend to have increased age-related cortical thinning in comparison with typically developing individuals (TD) (Hardan et al. 2009) . Conversely, Hazlett et al. found an increase in the surface area temporal, frontal, and parietal-occipital regions in 2 year old children with autism compared to controls, but no significant differences in the cortical thickness were reported (Hazlett et al. 2011) .
Gyrification patterns have also been studied in autism. Hardan et al. reported an increased left frontal gyrification index in autistic children and adolescents but not in adults (Hardan et al. 2004) . Nordahl et al. explored cortical folding across a range of patients between 7.5 and 18 years (Nordahl et al. 2007) . They identified cortical shape abnormalities across all ages, more pronounced in children. The patterns of abnormalities varied between low-functioning autism, high-functioning autism, and Asperger’s syndrome.
All of the aforementioned findings taken together, the increased amount of surface-based evidences suggest that early overgrowth in cortical volume in ASD may be associated with a disproportionate enlargement in cortical thickness and surface area across multiple brain regions, with a tendency to normalization at later stages of development. While still inconsistent, these results suggest that disruptions of cortical topology in preschool aged ASD children may underlie a distinct set of pathogenic mechanisms.
6.2.4 Automatic 3D Model-Based Morphometry
An alternative approach combines the characteristics of ROI-based analysis with voxel or surface-based techniques for obtaining the segmentation of individual MRI volume into different anatomical structures using a standardized atlas. Structural MRI with high spatial resolution is normalized into a standard space defined by a registration template. The resulting transformation is reversed to map the atlas structures onto the original brain geometry, thus enabling morphometric quantification. Different strategies have been utilized to merge information coming from registration algorithms and tissue classification for obtaining suitable gross cortical structure segmentation. Our group has used an approach based on individual brain atlases using statistical parametric mapping (IBASPM) to address brain morphometry in ASD. Figure 6.2 outlines this procedure. Panel 6 shows preliminary results from our group, consistent with a widespread increase in cortical volume, involving frontal, parietal, and occipitotemporal regions.
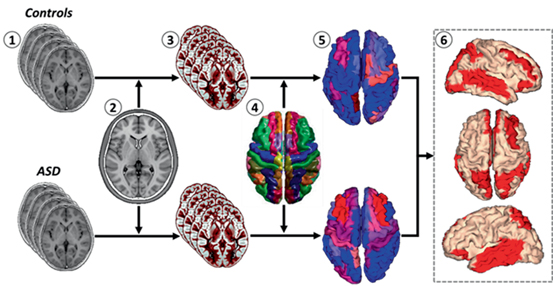
Fig. 6.2
Pipeline and results of an atlas-driven voxel based morphometry. 1 High resolution anatomical MRI. 2 Normalization to a standard space (e.g., MNI space). 3 Segmentation and extraction of the gray matter. 4 Atlas-based labeling. 5 Regional mean volumes were calculated via the atlas-based procedure described in (Aleman-Gómez et al. 2006) . 6 Dorsal and lateral views of statistical parametric maps showing increased volumes (red areas) in ASD children. Preliminary MRI data were obtained at the Institute of Neurology (INN) and International Center for Neurological Restoration (CIREN), in Havana
6.3 Functional Magnetic Resonance Imaging
The advents of higher magnetic fields and faster acquisition sequences have allowed the acquisition of dynamic data that brings together maximal signal-to-noise ratio and good spatial contrast in conjunction with whole-brain coverage. Functional MRI (fMRI), as opposed to traditional MRI procedures used to study brain anatomy, provides insights into dynamic brain changes having a time course closer to that of neurophysiological activities. The technique therefore has huge potential for addressing novel research questions regarding the abnormalities in human brain function underlying the core symptoms of ASD.
The relatively low temporal resolution and long acquisition time of fMRI challenged the extensive application of this technique in certain groups of patients, like children and low functioning autistic individuals. Despite these concerns, the contribution of fMRI to understanding aspects of the biology of ASD has been invaluable, as it has helped to establish that ASD is a distributed disorder comprising several neural systems. It is beyond the scope of this chapter to detail the extensive literature that explores the patterns of activation in response to dissimilar tasks. We will outline the main approaches and promising developments in the use of fMRI to study functional networks in ASD.
6.3.1 Activation Studies
There is a link between increased local neuronal activity and increased regional cerebral blood flow, blood volume, and blood oxygen content (Heeger and Rees 2002) . A slight but measurable local lengthened MR signal is driven by the imbalance between oxygenated and nonoxygenated hemoglobin. This blood-oxygen-level-dependent (BOLD) effect forms the basis for the use of fMRI, allowing the identification of brain regions used during the performance of a specific task. A wide and increasing number of researches have explored the patterns of activation related to core symptoms in ASD, using activation paradigms related to the sound and face processing, cognitive control, theory of mind tasks, language processing, or tasks involving imagery content, among others. Extensive reviews can be seen in the published literature (Anagnostou and Taylor 2011; Dichter 2012; Hugdahl et al. 2012; Stigler et al. 2011; Williams and Minshew 2007; DiMartino et al. 2009) . Figure 6.3 shows models of abnormal activity patterns in ASD in response to different paradigms used in fMRI. Note that these models consider the spatial location of the areas where abnormalities in activation have been consistently reported, regardless of the direction of the differences (hypoactivation or hyperactivation) given the variability in results and the limited space.
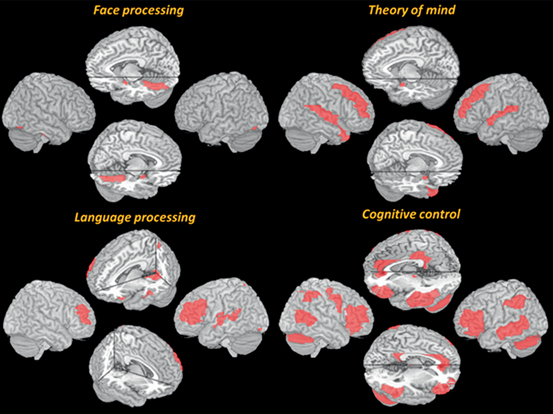
Fig. 6.3
The figure shows brain network activations across studies and experimental manipulations in ASD compared to TD individuals, visualized on a 3D MRI template. Abnormal activation maps were modeled using an MRI-based atlas, showing regions reported to be involved in specific tasks. See text for further explanations
The fMRI studies in ASDs have provided behavioral evidence of incapacity for emotional judgments about faces (e.g., the inability for reading of the intentions or emotions facially expressed by others) and impaired face recognition and discrimination (e.g., to discriminate between familiar and unfamiliar faces) in ASDs (Dichter 2012; Stigler et al. 2011) . ASD-related hypoactivation of the fusiform gyrus (Brodman area BA 37), labeled as the ‘fusiform face area’, has been reported across both studies of facial form and facial expression perception (Stigler et al. 2011) . The response of the amygdala to faces in ASDs has also been studied, with mixed and even inconsistent results (Dichter 2012; Hugdahl et al. 2012) . Individuals with ASD have been shown to have difficulty with the ability to infer feeling states and/or intentions, skills that are essentials for an appropriate social interaction. The fMRI studies have revealed that children and adults with autism show reduced activation throughout the medial prefrontal cortex, superior temporal sulcus, right temporal pole, and amygdala, engagedin the so-called “theory of mind” network (DiMartino et al. 2009) . Amygdala has received particular scrutiny in fMRI studies of theory of mind. Impaired modulation of activity in this area has been associated with the reduced social and communication abilities in ASD.
Autistic spectrum disorders (ASD) are associated with a wide range of language and communication impairments, ranging from a lack of functional speech to outstanding language abilities (Williams and Minshew 2007) . fMRI studies of communication deficits in ASDs have focused predominantly on brain regions mediating language perception, comprehension, and generation. Activation paradigms include auditory processing, sentence and language comprehension, verbal fluency, visual imagery, among others. Overall, these data support differential lateralization of language processing and production regions during communication tasks, neurofunctional deficits for speech and recruitment of brain regions that do not typically process language (Anagnostou and Taylor 2011; Dichter 2012; Williams and Minshew 2007) . Abnormal activation in the left inferior frontal gyrus (including Broca’s area) and superior temporal gyrus (i.e., Wernicke’s area) have been commonly reported in ASD. Autistic patients show abnormal activation of parietal and occipital brain regions, associated with visual imagery, for comprehending sentences that do not invite visual imagery (Dichter 2012) . This results suggest a processing strategy that more reliant on visualization to support language comprehension.
Studies of restricted and repetitive behaviors using fMRI are limited, realizing that head motion is a major source of error in data analysis. However, the cognitive manifestations of these features have been addressed using a variety of paradigms requiring cognitive control, including but not limited to spatial attention, working memory, interference inhibition, and response monitoring, revealing anomalous activation in frontostriatal brain regions(see (Dichter 2012) for review) .
6.3.2 Functional Connectivity
fMRI data cannot in itself prove causality, and such data can only state if a certain brain region is involved in a specific task. The fMRI-based connectivity (fcMRI) studies assess interregional temporal correlations of the BOLD signal. Thus, fcMRI studies in ASDs addresses circuitry-level questions believed to be central to autistic symptoms. Growing evidence indicates predominantly reduced long-distance functional connectivity in ASD. For example, lower connectivity between frontal and posterior parietal and temporal cortical regions has been consistently reported. This network plays central roles in processing social-affective information.
Furthermore, a marked decrease in connectivity between the right cerebellar region and the supratentorial regulatory language areas, and between the Broca’s regions and modulatory control dorsolateral prefrontal region, may underlie the abnormal language function in children with ASD (Just et al. 2012) . Cortical–cortical under connectivity has been replicated with a variety of fMRI paradigms related to core symptom domains, such as language comprehension, social cognition, executive function, or motor tasks (for review see (Anagnostou and Taylor 2011; Hugdahl et al. 2012; Stigler et al. 2011; Williams and Minshew 2007; Just et al. 2012)) .
6.3.3 Resting-State Functional Connectivity
Resting-state fMRI (rsfMRI) derives from the rationale that low frequency spontaneous oscillations in BOLD signal are temporally coherent among brain areas that are functionally and probably structurally connected. Thus, the resting-state network is believed to reflect a rudimentary and intrinsic organization of the resting brain, providing the opportunity to study long and short-range connectivity in ASD, without complications related to task activation. rsfMRI has been increasing applied to the study of the complex alterations of functional networks in ASD. Most of the results of such studies are consistent with decreased long-distance connectivity . There are reports of decreased frontal-posterior connectivity at rest in the default mode network in adolescents and adults with ASD (Weng et al. 2010) . Correlations between social and repetitive behavior symptoms and a number of resting connectivity metrics in individuals with ASD have been reported (Dennis and Thompson 2013; Anagnostou and Taylor 2011; Dichter 2012) .
More recent rsfMRI suggests that ASDs may also be characterized by aberrant increase in local functional connectivity . Posterior overconnectivity has been reported to be associated with higher ASD symptom severity (Keown et al. 2013) . In the same way, local overconnectivity in occipital and posterior temporal regions appears consistent with the preference for local over global visual processing in ASD (Maximo et al. 2013) . Monk et al. reported stronger functional connectivity between the posterior cingulate and the temporal lobe and parahippocampal gyrus in ASD (Monk et al. 2009) . Whereas under connectivity reflects reduced efficiency of within-network communication in ASD, degrading the capacity of integrating information from widespread and diverse systems, increased local connectivity can be attributed to impaired experience-driven mechanisms, and could be involved in the development of the outstanding capacities in some within the autistic spectrum.
Ongoing efforts attempt to map resting-state connectivity using sleep fMRI. This approach would appear to be well suited to studying early emerging brain activity linked to speech processing in infant, where classical rsfMRI studies are unlikely. In summary, rsfMRI findings reflect important aspects of network dysfunction associated with socio-communicative, cognitive, and sensori motor impairments in ASD.
6.4 Magnetic Resonance Spectroscopy
Magnetic resonance spectroscopy (MRS) provides a noninvasive method to measure the chemical concentration of certain metabolites in brain tissues, characterize tissue metabolic processes in vivo and identify chemical and structural abnormalities associated with diseases. The most widely used and relevant nuclei for in vivo biomedical applications are hydrogen (1H), phosphorus (31P), and carbon (13C). As nonproton MRS is still an emergent field and few studies have been reported in autism, the following section will focus on 1H-MRS and the analysis of the most important metabolites studied in ASD: N-acetyl aspartate, glutamate/glutamine, creatine/phosphocreatine, choline-containing compounds, and myo-inositol. Representative spectra of ASD and TD, that show the peak values of the typical metabolites, are displayed in Fig. 6.4.
Fig. 6.4
Representative 1H-MRS-SVS spectra in the temporoparietal junction of a typical development (TD) subject and autism spectrum disorder (ASD) subject. Notice a reduced NAA and Glx and increased Cho concentrations in ASD. The inset depicts the three-dimensionally localized MRS voxel. Data courtesy of the Brain Images Processing Group at CIREN, Havana
N-acetyl aspartate (NAA) is an amino acid that is present almost exclusively in neurons, neuronal projections, and mature oligodendrocytes. The NAA is considered as a marker of neuronal density and function and/or mitochondrial dysfunction, with the levels that increase during the early brain development until adulthood (van der Knaap et al. 1990) . A large number of studies in children reliably reveal that ASD patient’s exhibit reduced NAA levels in a wide number of cortical and subcortical brain regions. Consistently, reported areas with NAA reduction include global gray or matter; frontal cortex, anterior cingulate cortex, hippocampus-amygdala region, temporal and occipital lobes, thalamus, and cerebellum (for review see (Hyde et al. 2010; Raznahan et al. 2013; Anagnostou and Taylor 2011; Ipser et al. 2012; Chugani 2012)) . Decreased neuronal density would be the origin of disruptions in long-range fiber tracts, discussed in the next section, thus resulting in decreased NAA in both the grey and the corresponding white matter.
On the other hand, MRS at high fields allows for quantification of glutamate/glutamine compounds (Glx) addressing the role played by these excitatory metabolites in the neurochemistry balances in the ASD brain. MRS data from children cohorts indicate that autism groups exhibit reduced Glx levels in cortical gray matter (DeVito et al. 2007) , anterior cingulate cortex (Bernardi et al. 2011) , frontal and occipital cortex, and cerebellum (DeVito et al. 2007) . Recent research have suggested elevated Glx levels in ASD in the anterior cingulate cortex (Bejjani et al. 2012) and putamen (Doyle-Thomas et al. 2014) of children, and the auditory cortex of adults (Brown et al. 2013) . These results are consistent with the hyperglutamatergic theories of ASD, supporting an excitation/inhibition imbalance underlying the pathophysiology of ASD. Further researches are needed in larger cohorts of patients and solving methodological issues in the acquisition and processing of MRS spectra.
Metabolites’ levels are often reported as ratios with regard to chromium (Cr) concentration, instead of absolute metabolite levels. The explicit rationale for this approach is that Cr is assumed to be stable in the normal, as well as in several pathologic states. Ratios correct for the partial volume effect and MRI inhomogeneities, thus preventing the intra and inter-subject variance and are critical in quantifying low-abundance metabolites. However, Cr level is roughly considered as a measure of cellular energy metabolism, serving as the storage and use mechanism for ATP synthesis. A decrease in absolute concentrations has been reported during hypermetabolic process, probably in relation with homeostasis of cellular bioenergetics (Mountford et al. 2010) . Thus, the common practice of using creatine/phosphocreatine to calculate metabolite ratios may lead to confounding results in the study of ASD’s biochemistry. Relative to controls, reductions in Cr levels have been reported in the occipital cortex (Ipser et al. 2012) and global gray matter for ASD children (Friedman et al. 2006) . Ipser et al. reported in a meta-analysis based on 20 studies higher levels of Cr for ASD adults than children in global grey matter (Ipser et al. 2012) . A trend toward increases in the temporal lobe in adults has been also suggested.
Further neurochemical imbalances were found in other 1H-MRS studies, such as decreased concentrations of choline-containing compounds (Cho) and myoinositol (mI) suggesting decreased cellularity or density (Friedman et al. 2006) . A recent study found correlations between Glx, Cho, and mI in caudate, putamen, and thalamus, and behavioral scores in ASD children (Doyle-Thomas et al. 2014) . Additional studies will be needed to support these findings and elucidate the sensitivity of these metabolites to diagnosis of ASD.
Taken together, this evidence does not support the explanation that early structural overgrowth is due to an acceleration of the normal brain maturation processes. More likely, these findings are consistent with an excess of minicolumn density as described by Casanova and colleagues (Casanova and Trippe 2009; Casanova 2006) . Alternative hypotheses include reduced synaptic density, poorly differentiated cortex, and possibly inflammatory processes (Friedman et al. 2006) . Studies in adults provide further support that a typical change of neurochemical profile in ASD groups expands beyond childhood and persists during adulthood. Nonetheless, the conflation of age group, the overlap of diagnosis that meets the ASD criteria, the unmatched use of sedation, and the heterogeneity of regions studied, place limits on the strength of the conclusions that can be drawn from 1H-MRS studies.
6.5 Diffusion Tensor Imaging
6.5.1 White Matter Organization
Diffusion tensor imaging (DTI) is sensitive to loss of white matter integrity and to differences in anatomical connectivity. Fractional anisotropy (FA) is a measurement that indirectly reflects the diameter and density of fibers, myelination and macrostructural features such as fiber coherence, while mean diffusivity (MD) is a measure of the mean motion of water considered in all directions. Thus, lower FA or higher MD suggests a disruption in microstructural brain white matter features .
Children and adolescents with autism show areas of abnormal white matter integrity relative to TD subjects. Reports of decreased FA included white matter structures in the frontal and left temporal lobes (Ke et al. 2009) , inferior longitudinal fasciculus (ILF, comprising the right fusiform face area), superior longitudinal fasciculus (SLF), and corpus callosum/cingulum (Jou et al. 2011) . Abnormalities in white matter organization in ASD have been found to persist into adulthood. Regions of decreased FA in the corpus callosum of the frontal and temporal lobes were reported in participants with age ranging from older children and adolescents to adults (Keller et al. 2007; Alexander et al. 2007) . A wide meta-analysis including 25 DTI studies with regions of interest methods demonstrated consistently significant FA reductions in the corpus callosum, left uncinate fasciculus, and left superior longitudinal fasciculus, and significant increases of MD in the corpus callosum and superior longitudinal fasciculus bilaterally, in subjects with ASD compared with the TD individuals (Aoki et al. 2013) . These findings have been taken as evidence that white matter abnormalities may constitute the biological basis of the decreased functional connectivity in adults with autism, discussed in Sect. 3.1. However, an apparent tendency to normalization of white matter maturation over time has been reported, possibly accounting for the behavioral improvements often observed in high-functioning autism (Bakhtiari et al. 2012) .
6.5.2 Anatomical Connectivity
Diffusion tensor imaging (DTI) studies limited to voxel-wise comparisons of FA are useful for identifying the presence of white matter pathology in ASD, but are limited in its ability to identify the underlying fiber tracts involved. Several strategies have been implemented to achieve the tract reconstruction and connectivity analysis from DTI. The latest can be roughly divided into global or tract-based analysis, exemplified in Fig. 6.5. In the literature, a dominant finding with respect to the anatomical connectivity in ASD is that there is a combined pattern of local over-connectivity and long distance under-connectivity, illustrated for our data in Fig. 6.5b).
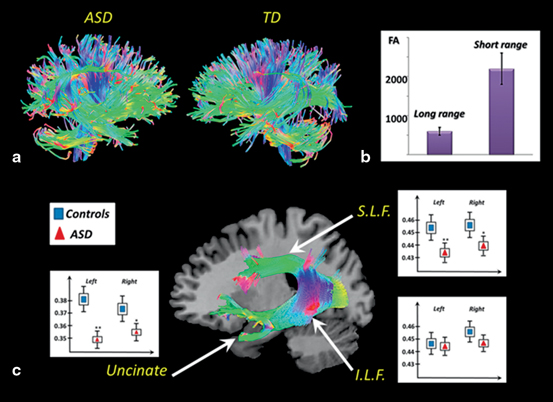
Fig. 6.5


Upper panel: example of global connectivity analysis. a Representative DTI reconstruction from an ASD subject and an age matched TD subject. The same reconstruction parameters, algorithms and thresholds were used. A reduction in fiber density and organization in ASD subject is noticeable. b Prevalence of short-range vs. long-range connectivity in ASD networks. Lower panel: example of tract-based analysis in 15 children with ASD and age matched controls. c Significant differences were found in the superior longitudinal fasciculus (S.L.F) and uncinate fasciculus, but not in the inferior longitudinal fasciculus (I.L.F). The figure has been compiled by the authors from several different studies conducted by the Brain Images Processing Group at CIREN
Related posts:


Stay updated, free articles. Join our Telegram channel
Full access? Get Clinical Tree
