Fig. 4.1
Measurements of site of brain atrophy on computed tomography. (a) maximum distance between the tips of anterior horns; (b) width between bilateral head of caudate nuclei; (c) maximum transverse inner diameter of skull; (d) maximum width of cella mediae. CHI (caudate head index), iCMI (inverse cella media index), and Evans’ ratio were calculated by the following formulas: CHI = 100B/C (%), iCMI = 100 D/C (%), ER = 100A/C (%). From: Yamano, Shigeru, Fuyuki Sawai, Yuta Yamamoto, Nobuyuki Sawai, Shigetoshi Minami, Mayumi Akai, Kumiko Nomura, Minoru Takaoka, Rie Fukui, and Kazuhiro Dohi. “Relationship Between Brain Atrophy Estimated by a Longitudinal Computed Tomography Study and Blood Pressure Control in Patients With Essential Hypertension.” Japanese Circulation Journal 63, no. 2 (1999): 79–84. doi:10.1253/jcj.63.79
A variant of CT that should be of particular interest in the research of hypertension in humans is computed tomography angiography (CTA). CTA combines CT with the use of contrast dyes to provide visualizations of arterial and venous vessels. CTA can be used to characterize structural changes in the vascularization of the brain to a greater resolution than that of MR or ultrasound [12]. The ability of CTA to resolve the entirety of vessel wall and lumen [13] will certainly provide advancements in our understanding of how hypertension manifests in the blood vessels of the brain. However, the use of CT as a research tool is controversial. The levels of ionizing radiation involved in a CT scan are of a higher dose than in plain-film radiology, and thus it is recommended that the use of CT be reserved for legitimate clinical reasons [14].
2 Single-Photon Emission Computed Tomography
Single-photon emission computed tomography (SPECT) has the capability of providing true three-dimensional information on cerebral blood flow, and neurotransmitter receptor function. The technique requires the intravenous delivery of a gamma-emitting radionucleotide (typically 133Xe or 99mTc-HMPAO); the brain is subsequently imaged with a gamma camera [15]. The radionucleotide can be attached to a ligand which in turn binds to a particular place of interest, such as brain metabolites (for determination of CBF) or a neurotransmitter receptor [16]. SPECT images, particularly those using the longer lasting tracer 99mTc-HMPAO, have delivered excellent correlations with CBF when compared to PET [17] and TCD [18]. Studies using acetazolamide, an agent known to increase CBF [19], in combination with SPECT have successfully assessed regional vasoreactivity and the efficacy of collateral circulation in stroke patients [20]. Despite its ability to provide high resolution functional images, both at rest [21], and in response to vasoactive substances [22], SPECT is surprisingly underutilized in cerebrovascular investigations [23]. Studies using SPECT in hypertensive patients could help in the characterization of regional CBF changes, as well as neurotransmitter receptor morphologies in the course of the disease. Unfortunately, there is a similar caveat to using SPECT in a research context as there is with CT, as the level of radiation exposure can be viewed as a hazard [24] (Fig. 4.2).
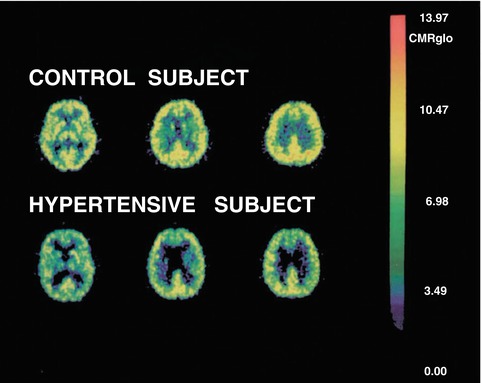
Fig. 4.2
Representative PET images from a hypertensive and an age- and gender-matched control subject. A total of 14 images were obtained at each PET study. The left, middle, and right images were taken 40 mm, 50 mm, and 65 mm above the inferior orbitomeatal line, respectively. The color scale on the right illustrates the range of rCMRglc (mg/100 g tissue/min) values found on the images. From: Salerno, J A, C Grady, M Mentis, A Gonzalez-Aviles, E Wagner, M B Schapiro, and S I Rapoport. “Brain Metabolic Function in Older Men with Chronic Essential Hypertension.” The Journals of Gerontology. Series A, Biological Sciences and Medical Sciences 50, no. 3 (May 1995): M147–54
3 Positron Emission Tomography
Positron emission tomography (PET) is a form of nuclear imaging technology that is able to produce three-dimensional images of neurological function. A positron-emitting radionucleotide tracer is bound to a biologically active molecule and injected into the patient. The PET scanner detects pairs of gamma rays emitted by the tracer molecule, and images are constructed by computer analysis dependent on the concentration of tracer molecule in three-dimensional space. PET techniques offer very powerful quantitative measures of CBF and metabolic activity in the human brain in a noninvasive manner. PET can produce images with a spacial resolution of ~3 mm; however, it is limited in its ability to track fast acting physiologic dynamics due to its relatively slow temporal resolution (~1 min). PET assumes a direct relationship between CBF and neuronal activity [25], so that regional CBF values acquired by PET reflect cerebral functional integrity [16]. PET investigations have shown that the hypertensive brain expresses longitudinal decline in regional CBF that precedes observable cognitive decline [26, 27]. Reports of reduced regional glucose [28] and oxygen [29] metabolism, as well as regional CBF [29–31] in hypertensive subjects, are suggestive of direct links between hypertension and brain metabolism. The research potential of PET is high, given its robust spacial resolution and its ability to provide quantitative flow and metabolic maps. PET is not without its drawbacks, though. On the scientific side, the poor temporal resolution and inability to perform continuous measurements limit the scope of experimental design to a pre-post paradigm. Logistically, given that the radioactive tracers are short lived, and thus require the availability of a cyclotron to produce the isotopes, brings with it the cost prohibitiveness of a dedicated nuclear facility. Finally, on the safety front, there is radiation exposure to the study participants, which needs to be maintained at a minimum.
4 Transcranial Doppler
Transcranial Doppler (TCD) measures cerebral blood flow velocity by emitting a high-frequency (typically 2 MHz) sound wave from an ultrasound probe and recording the frequency change of the wave reflected off of blood-borne materials (typically red blood cells). The velocity of the blood (CBV) in relation to the probe’s location and angle of insinuation results in a phase shift. This phase shift is directly correlated to the CBV. TCD provides noninvasive, continuous monitoring of blood flow estimates in the basal brain arteries, most commonly the middle cerebral artery [32]. TCD has been used extensively in hypertension research as it is a relatively inexpensive, easy to use, noninvasive technique which poses no radiation hazard. Studies have found that hypertensives have similar CBV values [33, 34], greater vascular resistance [35], and reduced cerebrovascular reserve capacity [36] when compared to normotensive controls. Besides CBV, TCD can also provide a pulsatility index (PI). PI is the mathematical difference between systolic and diastolic velocities, and is postulated to reflect the degree of downstream vascular resistance [37]. It has been suggested that increased PI in hypertensives is indicative of alterations in upstream cerebral arterioles [38] and may contribute to cerebral white matter lesion formation [39]. While TCD has a major role in investigating vascular changes in hypertension, it is not without its limitations. Due to variations in the thickness and porosity of bone, some patients lack proper “acoustic windows,” thus making it difficult to insonate the basal cerebral arteries or the circle of Willis. When compared to other techniques, the spacial resolution of Doppler ultrasound is quite low, and is limited to the large basal arteries, providing only an index of global, rather than local, cerebral blood velocity. In addition, consistent angle of insonation is highly dependent on the operator’s ability at handling the probe [40, 41] (Fig. 4.3).
Fig. 4.3
A 70-year-old woman with subarachnoid hemorrhage. Transcranial Doppler demonstrates an increased peak systolic velocity and mean flow velocity in the right middle cerebral artery, consistent with severe vasospasm. From: Naqvi, Jawad, Kok Hooi Yap, Gulraiz Ahmad, and Jonathan Ghosh. “Transcranial Doppler Ultrasound: A Review of the Physical Principles and Major Applications in Critical Care.” International Journal of Vascular Medicine 2013 (2013). doi:10.1155/2013/629378
5 Magnetic Resonance Imaging
Continuous advancements in magnetic resonance (MR) technology have allowed for improvements in qualification and quantification of the brain in hypertensive patients. The technological developments and increased accessibility of high-field MR imaging systems (3-T and above) have dramatically increased the effectiveness and sensitivity of both MR angiography (to evaluate structural morphologies in the cerebral vasculature) and MR perfusion (to evaluate region-specific volume changes) to the effects of hypertension on local vasculature. In addition, calibrated functional MR, particularly blood oxygen level dependent (BOLD fMRI), techniques are now being used to quantify regional neural metabolism in physiologic units allowing for reliable comparisons between cohort groups and over the time course of disease progression.
Rapid Gradient-Echo Magnetic Resonance Imaging. Rapid Gradient-Echo Magnetic Resonance Imaging (MP-RAGE) is a versatile research modality for use in investigations of brain structure. It is used to characterize a large array of cerebral characteristics, in both health and disease. Whole brain and regional cerebral volume changes can be assessed using T1-weighted imaging, with [42] and without contrast agents [43]. Anatomical MR studies of hypertensives have revealed frontal white matter loss [44] and lesion hyperintensities which may be indicative of local increases in water content and may reflect demyelination [45–47]). In particular, certain hyperintensities have been interpreted to be covert vascular brain injury related to hypertension [48]. Other structural MR studies have also provided some evidence to suggest that hypertension may lead to atrophy in the thalamus and temporal lobes [49, 50].
Magnetic resonance angiography. Magnetic resonance angiography (MRA) has been traditionally used as a diagnostic tool for the integrity of blood vessels in the human. In particular, MRA can detect occlusion, aneurysm, and vascular malformations. MRA provides better spatial resolution and therefore greater detail than CT angiography. Relatively new phase-contrast techniques (PCA) have advanced MRA into an assessment technique of cardiovascular risk and risk factors in the human brain. In addition to the structural information, PCA allows for the evaluation of the velocity of blood flow within a vessel or vascular bed. Total cerebral blood flow (CBF) can be determined using a modified Poiseuille equation ( ) from the measured diameter (2r) and velocity (MBV) over the entire vascular bed [51]. PCA has been successful in showing differences in CBF with cardiovascular disease [52] and in aging [53]. This modality has significant potential to characterize the changes in CBF over the time course of the pathology.
) from the measured diameter (2r) and velocity (MBV) over the entire vascular bed [51]. PCA has been successful in showing differences in CBF with cardiovascular disease [52] and in aging [53]. This modality has significant potential to characterize the changes in CBF over the time course of the pathology.Magnetic resonance perfusion. Perfusion-weighted magnetic resonance imaging (MRP), using the dynamic susceptibility contrast technique, provides measures of relative cerebral blood volume as well as characterization of regionally specific tissue transit times. This modality requires the bolus injection of a contrast agent while a series of low spatial resolution images of the whole brain are acquired [54]. MRP is used to as a characterization of the quantity of blood perfusing a volume of brain tissue over time, and is quantified by the effect of the contrast agent on the T2* signal. The signal is monitored over time, and total time between injection and uptake is recorded, with a drop in MR signal indicating multiple hemodynamic parameters. The finding that acute stroke patients treated to induce high blood pressure showed a significantly higher tissue perfusion value [55] suggests that total cerebral perfusion may be effected by long-term chronic essential hypertension.
Diffusion tensor imaging. Diffusion tensor imaging (DTI) is a relatively new but promising technique that can demonstrate relationships between hypertension and cerebral white matter microstructure. DTI uses diffusion-weighted imaging that assesses and visualizes white matter and nerve fibers on a millimeter-level scale [56]. Throughout the brain, water molecules spontaneously diffuse differentially in all directions, thus displaying an anisotrophy. The DTI technique requires that the MR field, in the form of gradient pulses, is encoded in one particular direction. Only those molecules displaced in the direction of the gradient pulse become visible. An examination of the differences in the diffusion measurements as the gradient direction is changed reveals the anisotrophic organization of axonal cells running in parallel. As diffusion occurs in all directions within the brain, DTI provides a true three-dimensional representation of cerebral tissue [57]. A study combining DTI determined white matter damage and brain biochemistry determined by magnetic resonance spectrography has shown axonal loss in hypertensive patients and normal aging [58]. DTI is poised to make important contributions to the understanding of network connectivity, and how these networks may be compromised in disorders such as hypertension [59] (Fig. 4.4).
Fig. 4.4
Group averaged ASL maps comparing mean baseline cerebral blood flow of ten normo- and six hypertensive patients. KS Dyson, FB Tancredi, H Girouard, and RD Hoge, unpublished results
Arterial spin labeling. Arterial spin labeling is a functional MR imaging (fMRI) technique that measures cerebral blood flow without the use of exogenous contrast agents. ASL achieves quantitative measurements by comparing the magnetic state of inflowing blood (spin labeled, or tagged, sample) to the magnetic properties of the static tissue in the brain. It provides direct, rapid, quantitative visualization [60]. Currently pseudo-continuous (pCASL) arterial spin labeling is the technique of choice. Continuous (CASL) labeling offers a larger signal-to-noise ratio over pulsed sequence tagging; however, magnetization transfer (MT) effects tend to nullify the signal advantage [61]. pCASL employs very fast (~1 ms) gradient pulses eliminating much of the MT to other tissues, while the short time allowed for relaxation of the arterial spin effects between pulses renders the pulse as almost continuous [62]. ASL is proving to be a powerful tool in the study of cerebral perfusion in hypertension, with recent studies showing that long-term chronic hypertension shifts the autoregulatory CBF curve rightward and downward and that this shift is reversible with BP lowering therapy [63] and that a diagnostic history of hypertension is related to brain hypoperfusion in older adults [64]. Future investigations using ASL techniques should prove useful in determining the relationship between systemic hypertension, regional CBF, and cognitive function.
Blood oxygen level dependent MR. The most common mode of fMRI used in clinical practice and research studies is blood oxygen level dependent (BOLD) fMRI. BOLD fMRI takes advantage of the contrast in the magnetic susceptibility of oxygenated vs. deoxygenated hemoglobin as the determinant of neural activity. This is visualized as an increase in signal in the local capillary bed associated with the activated neurons [65, 66]. The result is a qualitative assessment of neural activity represented by a %BOLD change from baseline. Contrast data, collected during the performance of particular tasks, are transformed into statistical maps of image differences, revealing task dependent patterns of activity in specific regions over time. BOLD images are acquired one slice at a time, and given that the typical cerebral vasculature hemodynamic response time is in the order of 6–8 s, high temporal resolution is required to sample the activity of multiple brain areas synchronously. The application of echo planar imaging in BOLD studies has proven successful at achieving reasonable spacial resolution (2 mm3) at slice acquisition times of less than one second [67]. The use of exogenous contrasts is being proposed to increase the temporal resolution of fMRI; however, these techniques are much more invasive and do not provide the spatial resolution afforded by the BOLD technique. The most promising of the proposed contrast techniques are temperature [68], calcium [69], and pH [70]. The advantage of BOLD over other techniques that require an exogenous contrast agent is that a number of scans can be performed on a single individual without risking the health of the participant and without having to compensate for contrast concentrations migrating to other brain regions over time. There is evidence, in animal models, to suggest that BOLD fMRI signal and CBF are associated with induced transient hypertension [52, 55]. Thus, BOLD may be able to detect hypertension-related microvascular pathologies. However, detection of abnormalities in transient induced hypertension may not relate to changes seen during acute hypertension in the human. A disadvantage of the BOLD fMRI technique is that oxygenation changes occur over the time frame of 4–7 s, thus limiting the temporal resolution. As well, a number of conditions, including stress related to the testing environment, claustrophobia in the magnet bore, among others, can raise blood pressure and consequently transiently modulate CBF. These factors, if they change over the course of a study, are difficult to account for in statistical models [71]. Changes in the hemodynamic response, either by structural or metabolic changes in the vasculature of hypertensives, may result in BOLD signals that are difficult to interpret. These concerns have led to the development of advanced calibrated BOLD fMRI techniques that will be outlined in the next section.
Calibrated fMRI. As the BOLD effect is dependent on many factors, including the rate of oxygen metabolism, neurovascular coupling, and the hemodynamic response, it has been difficult to interpret results across groups with differing vascular health profiles [72, 73]. Fortunately, calibrated fMRI techniques have been developed in an attempt to provide a quantitative assessment of oxygen metabolism at the region of neural activation from the changes in blood flow and volume derived from the qualitative BOLD fMRI signal. This is done by the addition of a calibration experiment in which simultaneous BOLD fMRI signal and CBF, determined by ASL, are recorded. The advantages of this approach, especially with hypertension, over the %BOLD change are obvious, in that CBF abnormalities, or transient changes in blood pressure due to factors outlined in the section on BOLD, can be factored out and cerebral metabolic rate of oxygen consumption (CMRO2), a more direct surrogate to neural activation, can be determined. In a similar way in which the ASL technique determines blood flow by subtracting the control signal from the labeled signal, calibrated fMRI attempts to subtract the resting deoxyhemoglobin (dHb) at rest. While it is not feasible to deplete all oxygenated hemoglobin in human subjects, hypercapnic vasodilation produced with breathing a mixture of 5 % CO2 in air can be used to achieve controlled partial washout of venous dHb that can be extrapolated to the maximal bold response, designated as the variable M [65, 74]. The principle is as follows: a hypercapnic gas mixture is breathed by the subject, thus eliciting a CBF response and BOLD signal change. The BOLD signal change in this event is caused purely by CBF as hypercapnia does not affect CMRO2. The simultaneous measurements of CBF from ASL and BOLD are combined in the model proposed by Davis and the result is used to estimate M. Another calibration factor can be obtained by using the addition of hyperoxic breathing, in which venous oxygenation is increased, thereby producing a BOLD signal change, while both CBF and CMRO2 remain constant [75, 76]. Studies of the visual cortex using a yellow/blue radial checkerboard pattern at maximal contrast showed agreement between calibrated BOLD fMRI results and estimations derived using positron emission tomography (PET), with a linear CBF– CMRO2 relationship [77, 78]. Validation of the accuracy of Δ% CMRO2 estimates using the model proposed by Davis, and the apparent linearity of the Δ%CBF–Δ% CMRO2 coupling, has been cause for some concern. These concerns include the constants (α and β) used in the Davis model. The constant α represents the change in cerebral blood volume (CBV) given a change in CBF, while β represents the R2*-[dHb] coupling. A value of α = 0.18 over the original value of α = 0.38 has been proposed to better reflect the venous component of the total cerebral blood volume [79, 80]. A novel generalized procedure for calibrated MRI has been developed, and validated for the visual cortex, in our lab [81]. This new procedure yields M estimates that were generally higher than those obtained through hypercapnia or hyperoxia, and we feel that these M values and their spatial distribution represent a more accurate and robust depiction of the underlying distribution of tissue deoxyhemoglobin at rest, resulting in more accurate estimates of evoked CMRO2 changes. It appears evident that applying the calibration techniques outlined in this section to hypertension research will clear up many of the inconsistencies found in the literature, particularly those found over time and across cohort groups. Unfortunately, the disadvantage of the low temporal resolution of blood oxygen change is still present in this method.
6 Summary
It is quite evident that hypertension has a profound influence on cerebral anatomy and physiology. The exposure to high pressure loads in the cerebral arteries and reduced blood flow to specific regions in the brain lead to changes in morphology of the blood vessels and neuronal metabolism. There is great potential to investigate the hemodynamic remodeling in hypertension with the use of TCD, PET, SPECT, and ASL technologies. CT and structural MRI modalities can provide further illumination into specific parenchymal damage, such as white matter lesions. Without doubt, in order to more fully understand the influence of hypertension on the form and function of the human brain, a combination of investigative imaging technologies will need to be employed. However, as the boundaries of MR technology (in hardware, software, and experimental design) are pushed ever wider, there exists a great potential for MRI to be the foundation of noninvasive investigation into the effects of hypertension on the human brain. Structural imaging methods such as MR angiography, diffusion tensor imaging, and MR perfusion techniques can be used to investigate the structural changes to white matter regions as well as blood vessel morphologies. Pseudo-continuous arterial spin labeling is emerging as a powerful tool for determination of regional and total cerebral blood flow. Improving calibration methods is making it possible to quantify changes in BOLD signals over the progression of hypertension, and increases the validity of studies that would compare groups of hypertensives to other cohorts.
Related posts:
 Hypertension and Brain Inflammation: Role of RAS-Induced Glial Activation
 A Systematic Review of Reviews to Examine the Association Between Hypertension and Cognitive Impairments in Adults
 Arterial Stiffness and the Brain
 Endothelium, the Blood–Brain Barrier, and Hypertension
 Cognitive Dysfunction and Dementia in Animal Models of Hypertension
 Hypertension and Stroke
Stay updated, free articles. Join our Telegram channel

Full access? Get Clinical Tree


