Fig. 3.1
Regions with hypermetabolism in anorexia nervosa patients and controls. The figures were depicted in neurological orientation. The gray-scale image was a T1 structural MRI that is representative of MNI space. Red areas were where the anorexia nervosa patients exhibit higher relative activity than control subjects

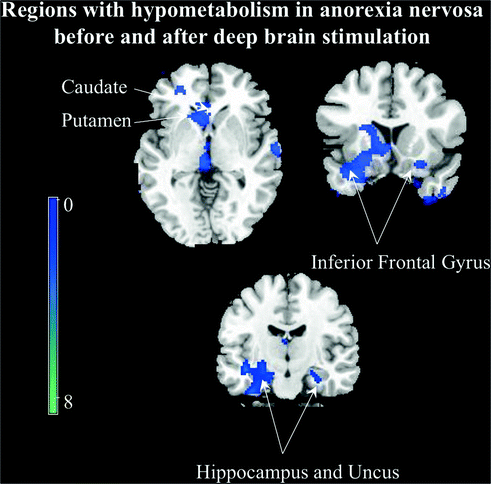
Fig. 3.2
Regions with hypometabolisem in anorexia nervosa patients and controls. Blue areas were where the anorexia nervosa patients exhibit lower relative activity than control subjects
3.6 Obsessive Compulsive Disorder (OCD)
MR-based perfusion imaging in OCD is rare. A study examined the changes in rCBF during symptom provocation and reported most changes in the orbitofrontal-subcortical circuits (i.e., elevated rCBF in the orbitofrontal cortex, caudate nucleus , and thalamus) [43]. Lower CBF in the orbitofrontal cortex and higher rCBF in the posterior cingulate predicted better treatment response. OCD has been more commonly studied using nuclear medicine-based perfusion imaging. Increased perfusion was reported in the right orbitofrontal cortex, bilateral frontal cortex, left premotor cortex, and left precuneus. Based on the findings of perfusion imaging, the orbitofrontal cortex seems to the key region involved in OCD. Therefore, elevated orbitofrontal CBF during symptom provocation may be specific to OCD.
FDG PET is ideally suited to map the dysfunctional cortico-striato-thalamo-cortical circuitry previously reported in OCD. Increased metabolism in the orbital gyrus, caudate nuclei, and cingulate gyrus, suggests dysfunction in these regions in OCD. Stimulation of a ventral striatum/ventral capsule target has been shown to significantly activate the orbitofrontal and anterior cingulate cortices, striatum, globus pallidus, and thalamus [44]. Furthermore, metabolic studies have shown that stimulation of the anterior capsule induced a decrease in prefrontal metabolic activity, especially in the subgenual ACC, which is considered to reflect an interruption of the cortico-thalamo-striato-cortical circuit. In addition, the degree of improvement in OCD inversely correlated with the metabolism of the left ventral striatum, amygdala, and hippocampus. All these findings support a major role for the dysfunction of the limbic circuits in OCD pathophysiology and show that DBS modulates these pathways [45] (Figs. 3.3 and 3.4).


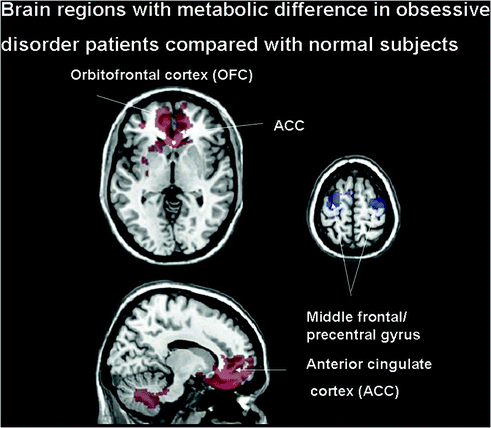
Fig. 3.3
Brain regions with significant metabolic differences in obsessive compulsive disorder (OCD) patients compared with normal subjects. Normalized glucose metabolism in the OCD patients increased (red) bilaterally in the orbitofrontal cortex (OFC)/anterior cingulate cortex (ACC), inferior frontal gyrus; but decreased (blue) bilaterally in the occipital cortex and supplementary motor area relative to the normal controls

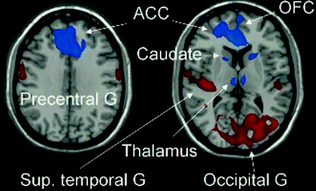
Fig. 3.4
Brain regions with significant metabolic changes in obsessive compulsive disorder (OCD) patients after bilateral capsulotomy. Normalized glucose metabolism in the OCD patients decreased (blue) bilaterally in the anterior cingulate cortex (ACC)/orbitofrontal cortex (OFC), caudate and thalamus after the surgery ; but increased (red) bilaterally in the precentral gyrus, the occipital cortex extending to the cerebellum, and the superior temporal gyrus relative to the preoperative baseline
3.7 Clinical Applications
Neuroimaging is routinely used for workup of patients with psychotic disorders because lesions in the frontal or temporal lobes, most often tumors, can present with psychosis [46]. In older people with cognitive impairment, it may be difficult to differentiate a neurodegenerative disorder from depression. Neuroimaging may be helpful in this situation by revealing characteristic of Alzheimer’s disease (AD), diffuse Lewy body disease, or one of the fronto-temporal dementias. Neuroimaging for psychiatric disorders has to contend with the diagnostic issues in psychiatry. The neurobiology of psychiatric disorders is likely to be highly heterogeneous. Thus, the neuroimaging findings in psychiatric disease may lack specificity and often fail to reveal a clear connection to a single neurobiological disturbance. Currently, the neuroimaging pattern determined in a study of a single patient with a psychiatric condition does not allow for an accurate diagnosis. Some characteristic findings, however, have been derived from samples of patients with each of the psychiatric diagnostic groupings [16].
3.8 Drug Discovery and Development
Neuroimaging can be helpful at several levels of drug discovery and development [47]: (1) characterizing preclinical models; (2) conducting early clinical studies to show that target engagement by the new drug induces the biological changes expected to give clinical benefit; (3) evaluating patients in clinical trials to demonstrate proof of concept. In other words, engaging a particular target can be shown to be linked to a meaningful change in a clinical endpoint observable via neuroimaging, thus providing evidence supporting the treatment being studied. Since neuroimaging can likely enable in vivo observation of brain structure and function, it could potentially provide ideal biomarkers for therapeutic intervention development. Considering the definition of biomarker [47], most neuroimaging methods do not meet the biomarker standards for now. However, some methods have the potential to be used as biomarkers or pre-biomarkers because they allow for identification of therapy-relevant characteristics of the disease. For instance, by examining striatal DA D2 receptors in a [11C]raclopride PET scan, a link was found between D2 receptor occupancy by a drug and a reduction in the positive symptoms in schizophrenia; ascending doses of up to 80 % receptor occupancy were progressively more effective in relieving delusions and hallucinations [48].
In a conclusion, neuroimaging is being increasingly applied for the development of psychiatric therapies. Neuroimaging is clinically relevant for diagnosis and differential diagnosis. It can yield further insights into the mechanisms of psychiatric diseases. Neuroimaging provides the pre-clinical researcher a relatively easy method to test whether a potential drug target shows an abnormality in a psychiatric disorder and whether, therefore, its correction may be therapeutic. Finally, by identifying the individuals who manifest the expected pharmacological action of the drug, neuroimaging can aid in personalized medicine by selecting individuals most likely to benefit from a particular treatment in a clinical trial.
References
1.
2.
3.
Sun D, et al. Elucidating a magnetic resonance imaging-based neuroanatomic biomarker for psychosis: classification analysis using probabilistic brain atlas and machine learning algorithms. Biol Psychiatry. 2009;66(11):1055–60.PubMedCentralPubMedCrossRef
4.
5.
6.
Thompson PM, et al. Time-lapse mapping of cortical changes in schizophrenia with different treatments. Cereb Cortex. 2009;19(5):1107–23.PubMedCentralPubMedCrossRef
Stay updated, free articles. Join our Telegram channel

Full access? Get Clinical Tree


