Fig. 1
Two NeMo control units (NIRS instruments) are connected to the sensors NeMo Patch (plaster-based patch, strictly noninvasive approach) and NeMo Probe (brain tissue probe, minimally invasive approach)

Fig. 2
Monte Carlo simulation of light propagation at 800 nm in a layered head model (a). The light intensity is shown in a logarithmic scale. Light guiding occurs in the cerebrospinal fluid layer, which has a slightly higher refractive index than the surrounding tissue. On a plaster-based patch, two detectors are placed at different distances from the laser source (detector 1, 4 cm; detector 2, 2 cm away from the light source) (b)
Regular measurements were performed daily and repeated after 15 min under stable clinical conditions (unchanged ICP, mean arterial pressure and arterial partial pressure CO2). Central venous injections of 0.3 mg/kg body weight (bw) ICG were performed into a tube leading into an antecubital vein, followed by 10 ml glucose 5 % flush. ICG dye dilution curves obtained with the probe and patch were collected simultaneously and analysed for blood flow values (NeMoSystem®, NeMoDevices, Zurich) based on published algorithms [10]. Measurement values are expressed in mean and standard deviation (SD). Measurement values are compared applying Wilcoxon matched pairs and calculating the correlation coefficient (Pearson; 2-tailed).
Results
In a first patient, 12 measurements in parallel with the probe and patch were performed. Mean measurement values for the mean transit time of ICG (mttICG), cerebral blood flow (CBF) and cerebral blood volume (CBV) obtained with the probe, as well as for the mean transit time of ICG (EmttICG), blood flow (ECBF) and blood volume (ECBV) obtained with the patch including signals from extracerebral tissue are given in Table 1. Mean values for the mttICG obtained with the probe were significantly shorter compared with those obtained with the patch (for detector 1, p = 0.002; for detector 2, p = 0.002). Mean CBV obtained with the probe was significantly higher compared with the values obtained with the patch (for detector 1, p = 0.002; detector 2, p = 0.002). The corresponding values for CBF were higher for the probe compared with those obtained with the patch (for detector 1, p = 0.002; for detector 2, p = 0.002). There were no significant differences between EmttICG obtained with the patch detectors 1 and 2. However, ECBV and ECBF values obtained with detector 1 were slightly but significantly lower than those obtained with detector 2 (for ECBV, p = 0.003; for ECBF, p = 0.004).
Table 1
Mean measurement values for the mean transit time of ICG (mttICG), cerebral blood flow (CBF) and cerebral blood volume (CBV) obtained with the probe, as well as for the mean transit time of ICG (EmttICG), blood flow (ECBF) and blood volume (ECBV) obtained with the patch including extracerebral tissue
NeMo Probe (n = 12) | NeMo Patch (n = 12) | ||
|---|---|---|---|
Detector 1 | Detector 2 | ||
MttICG mean (s) | 9.1 ± 1.3 | ||
EmttICG mean (s) | 15.9 ± 3.2 | 15.4 ± 1.9 | |
CBV mean (ml/100 g) | 3.7 ± 1.0 | ||
ECBV mean (ml/100 g) | 1.3 ± 0.3 | 1.6 ± 0.4 | |
CBF mean (ml/100 g/min) | 24.8 ± 9.1 | ||
ECBF mean (ml/100 g/min) | 5.1 ± 1.8 | 6.6 ± 2.1 | |
The Monte Carlo simulations (Fig. 2a) show that, close to the source, light received by detector 2 is strongly reflected by the cerebrospinal fluid. At a larger distance from the source, most of the light that is received by detector 1 comes from the grey matter and a small portion from the white matter. CBF values obtained with the probe correlated significantly with blood flow values obtained with the patch (for CBF vs. ECBF detector 1, r = 0.72 (p = 0.008); ECBF detector 2, r = 0.79 (p = 0.002)).
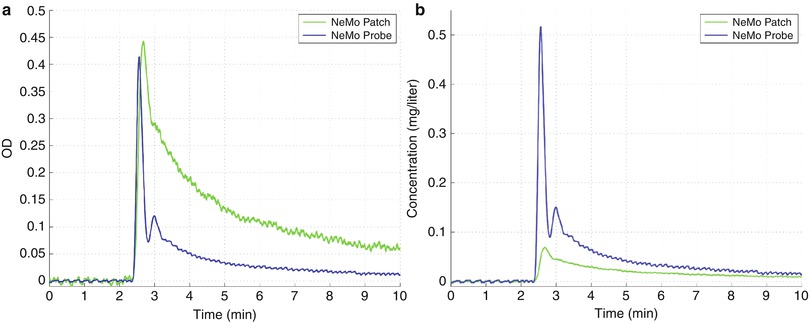
Figure 3 shows dye dilution curves after ICG injection in optical density (OD) and in ICG concentration performed in parallel with the probe and patch. The maximum of the amplitude of the dye dilution curve measured with the probe occurs earlier and the amplitude is higher compared with NIRS measurements obtained with the patch through the scalp.


