Fig. 1
The sequence of events in the delayed response task
3 Results
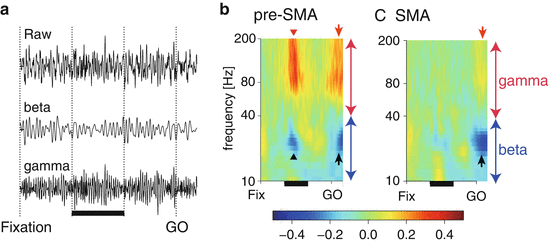
The monkeys performed the appropriate movements in response to the visual instructions, and LFPs were recorded in the pre-SMA and SMA during the behavioral task. A total of 57 sessions were recorded in the pre-SMA and 51 in the SMA for monkey M, and 345 were analyzed in the pre-SMA and 191 in the SMA for monkey N. Figure 2a shows an example of LFP activity recorded in the pre-SMA. The LFP fluctuated significantly, and contained several frequency oscillatory components. The beta power (10–40 Hz) of the LFP increased during the initial 500 ms and delay period, but was suppressed during presentation of the stimulus and after the GO signal. Although the power of the gamma oscillation (40–200 Hz) was increased throughout the trial, it was more pronounced during presentation of the stimulus.


Fig. 2
Representative LFP activity. (a) Raw LFP data recorded from the pre-SMA of monkey M (top), the 10–40 Hz (beta) component of LFP (middle), and the 40–200 Hz (gamma) component of LFP (bottom). The horizontal thick bar indicates the period of visual stimulus presentation. (b–c) A time frequency plot of the average of the power of LFP in the pre-SMA (b) and SMA (c) of monkey N. The LFP activity was normalized by power during the 0–500 ms after the fixation. The colors indicate the z-score of the power: red triangles and arrows indicate the activation of gamma power, whereas black triangles and arrows indicate the suppression of beta power. An example of the LFP activity
Figure 2b, c show the time-frequency plots of an average of the LFP power of monkey N. The LFP power in each trial was normalized by the power during the initial 500 ms (0–500 ms from fixation). In the pre-SMA (Fig. 2b), gamma power increased phasically during the stimulus presentation and after the GO signal, as indicated by the red triangle and red arrow, respectively. During the delay period (the period between the stimulus presentation and the GO signal), gamma power remained at baseline. In addition, beta power decreased concurrently with the increase in gamma power, indicated by the black triangle and arrow. In the SMA (Fig. 2c), the increase in gamma power was not observed during stimulus presentation, and only occurred after the GO signal, shown by the red arrow. In contrast, the beta power decreased only after the GO signal, indicated by the black arrow.
To examine if the power of the LFP oscillations changed according to the arm used, we used Welch t-test to compare the LFP power with ipsilateral and contralateral arm use. The time-frequency plots of power differences with arm use are shown in Fig. 3a, b. Thick horizontal lines indicate the period of stimulus presentation, and the color codes indicate the regions where oscillations were significantly stronger for either ipsilateral (red) and contralateral arm use (blue). Beta and gamma oscillations showed different lateralization according to the arm use. Specifically, gamma power was significantly stronger when monkeys were about to perform a movement with the contralateral arm compared with the ipsilateral arm (p < 0. 01), whereas beta power was significantly stronger with ipsilateral arm use (p < 0. 01). The significant regions of the pre-SMA were broadly distributed, whereas the distribution in the SMA was biased to the period immediately following the GO signal. Interestingly, the distribution bias of beta power resembled that of gamma power.


