Fig. 1
Comparisons of intensity values before and after endarterectomy. Intensity values increased significantly in each region of interest after endarterectomy, especially in the region of the plaque
Case Presentation
A 70-year-old woman with a history of hypertension was shown to have left internal carotid artery stenosis on carotid ultrasonography. Carotid angiography showed a 64.0 % stenosis using the NASCET method. Carotid endarterectomy was performed using a shunt. Before CEA, ICG-VA showed a lower intensity value in the region of the plaque than in other regions, with a slight increase in intensity in the late phase because of the vasa vasorum (Fig. 2a–d). The time-intensity curve did not document a peak in the region of the plaque. After CEA, these abnormalities diminished and internal carotid artery patency was confirmed (Fig. 2e–h).
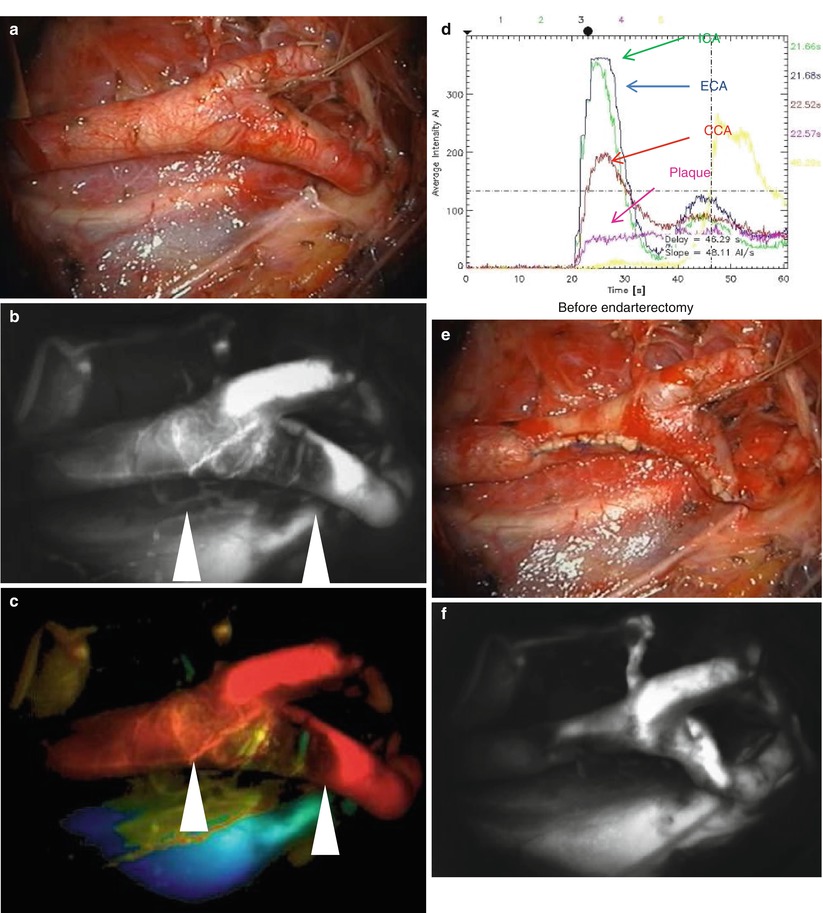
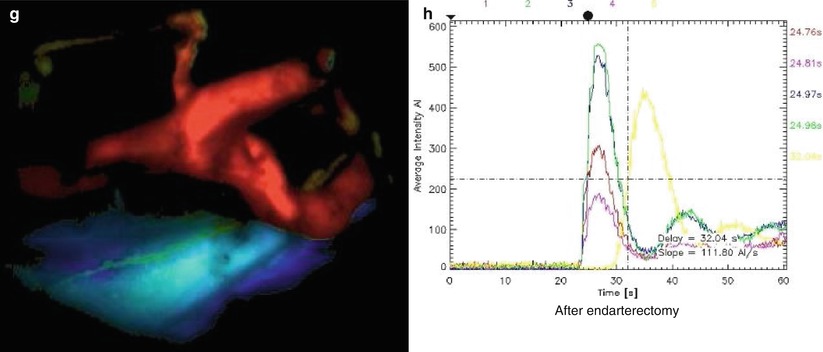
Fig. 2
(a–d) Before CEA. (e–h) After CEA. (a, e) Surgical views. (b, f) Maximum-intensity maps. (c, g) Time-intensity maps. (d, h) Time-intensity curves. (b, c) Show the location of the plaque as a dark area (arrowheads). (d) Before CEA, the plaque caused flattening of the pink curve. (f–h) The examination findings improved after CEA
Discussion
Our results show the efficacy of using ICG-VA during CEA. We were able to identify the plaque before CEA as a region of relatively low intensity on ICG-VA [3]. This was especially useful for determining whether the distal end of the plaque was located in the internal carotid artery. As we routinely use a shunt during CEA, it is important to perform adequate dissection for shunt placement. In three cases we were not able to confirm blood flow in the distal part of the internal carotid artery using ultrasonography, but were able to identify the distal end of the carotid plaque using ICG-VA. We were able to confirm patency of the internal carotid artery after CEA in all cases using ICG-VA. Blood flow can also be assessed intraoperatively using ICG-VA. In one case in which the internal carotid artery was perfused via retrograde flow, cerebral angiography had indicated antegrade flow. As ICG is administered intravenously, blood flow might be shown more accurately than in cerebral angiography where the contrast agent is administered via the carotid artery.
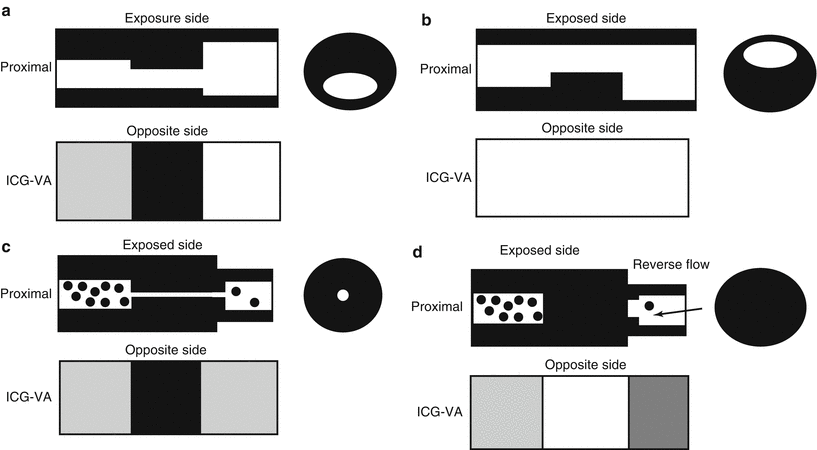
When using FLOW 800, the intensity diagram function helps to visualize the variation in blood flow over time. We can freely define which regions of interest are to be evaluated. The locations of plaques are shown as low intensity (dark) regions. After CEA, the intensity values of all regions increased significantly. We assumed that intensity values would inversely correlate with the thickness of the arterial wall at the surgical site (Fig. 3). The thickened wall at the site of the plaque showed as a low intensity region as the near-infrared light did not pass through easily, while the thin wall of the artery after CEA showed as a high intensity region. In some cases with high-grade stenosis, ICG-VA did not reflect the wall thickness because the decreased blood flow delivered only a small of amount of ICG, resulting in flattening of the time-intensity curve analyzed by FLOW 800.
 of Combined Coiling and Neuroendoscopy in the Treatment of Intraventricular Hemorrhage Due to Ruptured Aneurysm
Mini Supra-orbital Approach for Cerebral Aneurysm of the Anterior Portion of the Circle of Willis
Basilar Artery Aneurysms: Conditions for Safe and Secure Clipping
Resolution Imaging of Cerebral Small Vessel Disease with 7 T MRI
in the Treatment of Unruptured Aneurysms
of Bypass Surgery and Balloon Occlusion Test for the Endovascular Management of Fusiform Dissecting Aneurysms. Report of Two Cases
of Combined Coiling and Neuroendoscopy in the Treatment of Intraventricular Hemorrhage Due to Ruptured Aneurysm
Mini Supra-orbital Approach for Cerebral Aneurysm of the Anterior Portion of the Circle of Willis
Basilar Artery Aneurysms: Conditions for Safe and Secure Clipping
Resolution Imaging of Cerebral Small Vessel Disease with 7 T MRI
in the Treatment of Unruptured Aneurysms
of Bypass Surgery and Balloon Occlusion Test for the Endovascular Management of Fusiform Dissecting Aneurysms. Report of Two Cases


Related posts:
of Combined Coiling and Neuroendoscopy in the Treatment of Intraventricular Hemorrhage Due to Ruptured Aneurysm
Mini Supra-orbital Approach for Cerebral Aneurysm of the Anterior Portion of the Circle of Willis
Basilar Artery Aneurysms: Conditions for Safe and Secure Clipping
Resolution Imaging of Cerebral Small Vessel Disease with 7 T MRI
in the Treatment of Unruptured Aneurysms
of Bypass Surgery and Balloon Occlusion Test for the Endovascular Management of Fusiform Dissecting Aneurysms. Report of Two Cases
Stay updated, free articles. Join our Telegram channel
Full access? Get Clinical Tree
