Fig. 1
Synaptic strength distribution. Histogram of outer-cluster synapses (shown in blue) compared with inner-cluster (red) on a log scale displays the bimodal distribution all synapses demonstrate, as well as the difference in volume between both types. Strong synapses constitute a larger fraction of inner-cluster synapses than outer-cluster synapses. STD bars shown in black
2.2 Common Neighbor Rule
Number of common neighbors (NCN), which is the principle guideline for cluster identification in this paradigm, therefore proves to be a good predictor of synaptic strength and connection probability. In consistence with what has been reported in Perin et al.[3], the more common neighbors two neurons share, the more likely they are to be connected, and the stronger the connection between them tends to be. Compliance to NCN is especially noteworthy as our networks stem from random distance dependent connectivity and Hebbian principles alone. NCN is used only as a retrospect analysis tool, in contrast to the work done by Perin et al., where it was also used as the guideline for network wiring.
2.3 Network Topology
Networks which underwent simulation are left with a degree distribution which is binomial looking with a positive skew. Median falls very close to the mean value, but right tail is evidently longer than left one (Fig. 2). Further classification of the network based on clustering coefficient and average shortest path as described in Watts and Strogatz [18], reveals that traits resemble those of a small-world network (Table 1). While the average shortest path of our network is almost the same as in a completely random network, clustering coefficient is almost twice that of a random network. Small-world network topology is found in abundance in nature. It indicates the network has a small degree of separation within it, but still connectivity is not random. Nodes connect to each other based on some logic, and the resulting clustering coefficient is higher than would be expected by chance.
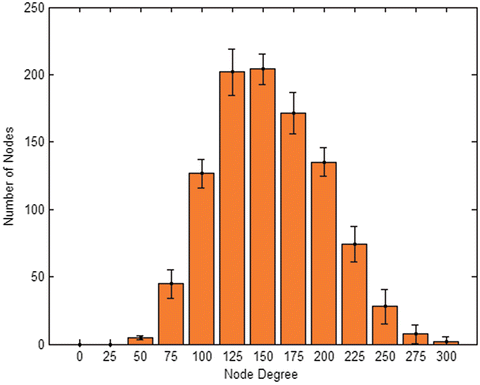
Fig. 2
Avg. network degree distribution. – median = 151.7 ± 4.8 – mean = 155.3 ± 4.7 – skewness = 0.24 ± 0.1
Table 1
Comparison of network clustering coefficient and average shortest path with two networks bearing same number of edges – a completely regular network on one hand and a completely random one on the other. Our network falls in the characteristics of a small-world network due to a high clustering coefficient relative to its short average path
Clustering coefficient | Avg. shortest path | |
|---|---|---|
Regular network | 0.74 | 7.08 |
Random network | 0.07 | 1.92 |
Our network | 0.13 | 1.97 |
2.4 Effect of Martinotti Inhibition
Isolating MC inhibition from simulation, it seems the chief influence of this pathway is the regulation of neuron activity in one area over the other. While BC inhibition is the core cause of lateral competition and local clustering, simulations lacking MC inhibition result in a highly uneven network. Without this type of inhibition, selected areas of the network grow constantly stronger with less and less competition. Lacking MC inhibition, an average of three clusters (7 %) account for over half of the spikes produced by the network, one of them over 25 % by itself (Fig. 3). This cluster reigns supreme over an obvious hierarchy shaped within the network, in terms of firing volume and average synaptic strength alike.
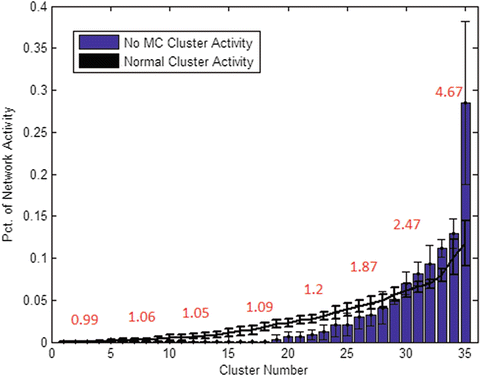
Fig. 3
Effect of MC pathway. Sorting clusters by spike volume reveals that lack of MC (blue bars) results in a much less even distribution of activity between clusters. One cluster produced over 25 % of network activity alone, compared to the avg. 10 % maximum clusters reach in normal simulations (black line. STD bars drawn vertically). Red numbers indicate average cluster synaptic strength (in mV EPSP), which rises dramatically in correlation with firing volume
3 Discussion
3.1 LBC-MC Circuitry
The dual inhibition described in this research accounts for clustering of Pyramidal Cell neurons, due to dynamics of competitive activity which it promotes. Regions rival each other over different input via LBC lateral inhibition, earning input selectivity in a manner reminiscent of Self Organizing Maps. MC inhibition steps into this competitive scheme to restrict “winning” regions for a certain amount of time after they have been active. This self inhibition is crucial for an equal spread of activation in the network. Without it, most network connectivity will degenerate and the network will be deprived of input selectivity. MC behavior seems to be solving the AI learning problem of “dead units”. Dead units are a problem suffered by hard competitive learning algorithms in which computational units may be neglected and not used in the final outcome of learning. MC seems to be analogous to a learning “conscience”, restricting overly-successful regions to make competitive learning “fair” [19].
In this light, PC-BC-MC wiring may be a connectivity pattern selected throughout evolution to give neuronal networks an intrinsic inclination to learn and accommodate themselves to incoming dynamic patterns. Each neuron can potentially be a cluster center to begin with. It is the unique stimulus history which will form certain clusters and not others in different networks following different experiences, but in agreement with the insight also given in Perin et al. [3], a clustered layout seems to be inevitable under these dynamics.
3.2 Clustered Network Topology
Simulated networks show traits most similar to small-world networks, maintaining an average short path between any two nodes under a relatively clustered layout. This structure seems to afford quite an optimal balance between network transmission speed and local connectivity.
Related posts:
 Integrated Neuropsychiatric Assessment System: A Generic Platform for Cognitive Neurodynamics Research
 Dynamic Temporal-Topological Structure of Brain Network Within ADHD
 Activity Patterns in Cortical Dynamics and the Illusion of Localized Representations
 on the Neural Energy Coding
 Interactions of Two Individual Arm Robots Using Independent Chaos in Recurrent Neural Networks
Stay updated, free articles. Join our Telegram channel

Full access? Get Clinical Tree


