Fig. 1
Graphs showing the correlations of the weight of wet cerebrum (WWC), brain water content (BWC), and neurological scoring (NS)
Table 1
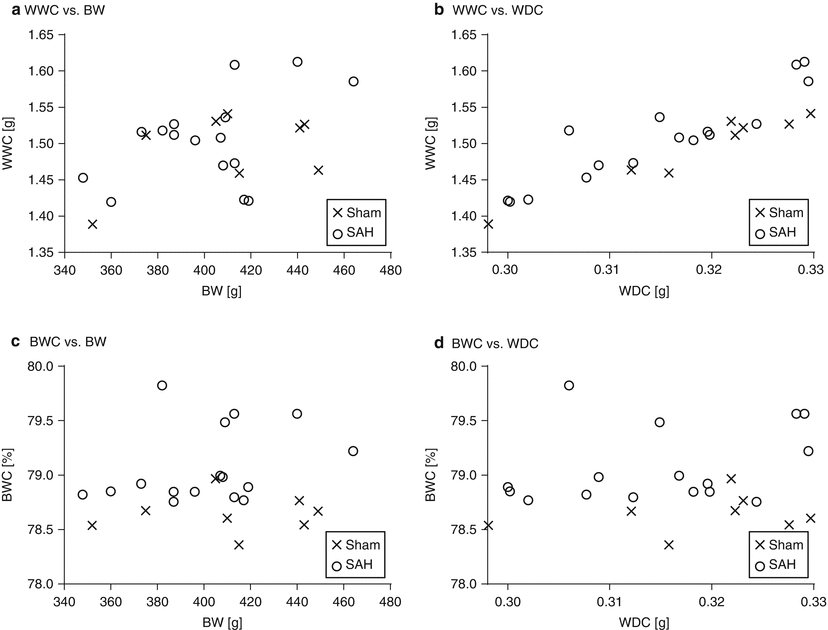
Correlations among neurological scoring (NS), weight of wet cerebrum (WWC), brain water content (BWC), body weight (BW), and weight of dry cerebrum (WDC)
WWC vs. BWC | WWC vs. NS | BWC vs. NS | WWC vs. BW | WWC vs. WDC | BWC vs. BW | BWC vs. WDC | |
|---|---|---|---|---|---|---|---|
All rats (n = 24) | r = 0.41, p = 0.05 | r = −0.28, p = 0.18 | r = −0.73, p < 0.01 | r = 0.44, p = 0.03 | r = 0.89, p < 0.01 | r = −0.02, p = 0.91 | r = −0.05, p = 0.80 |
Sham-operated rats (n = 8) | r = 0.47, p = 0.24 | r = 0.41, p = 0.28 | r = 0.33, p = 0.39 | r = 0.47, p = 0.24 | r = 0.97, p < 0.01 | r = 0.08, p = 0.85 | r = 0.25, p = 0.55 |
SAH rats (n = 16) | r = 0.58, p = 0.02 | r = −0.67, p < 0.01 | r = −0.62, p = 0.02 | r = 0.47, p = 0.06 | r = 0.92, p < 0.01 | r = 0.24, p = 0.35 | r = 0.25, p = 0.33 |
The Implication of Body Weight and Original Brain Weight for the Values of Weight of Wet Cerebrum and Brain Water Content
Next, the brains of all rats were examined for the influence of BW and WDC, both of which could affect the values of WWC and BWC (Fig. 2 and Table 1). WWC had a strong correlation to WDC and a moderate correlation to BW in all rats. Conversely, BWC had no relationship to BW or WDC.


