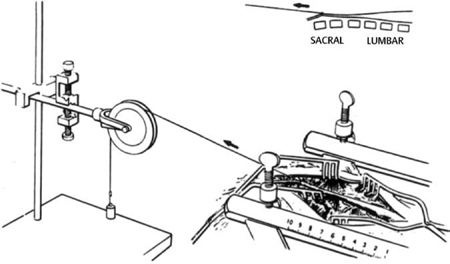
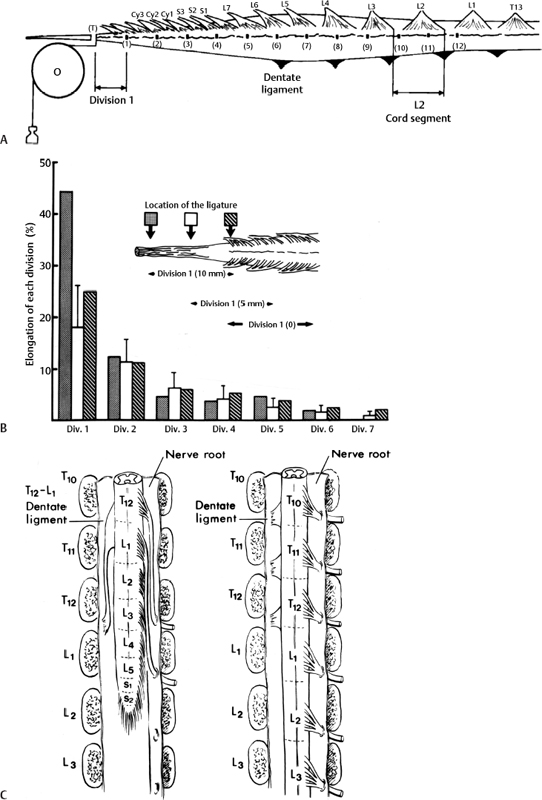
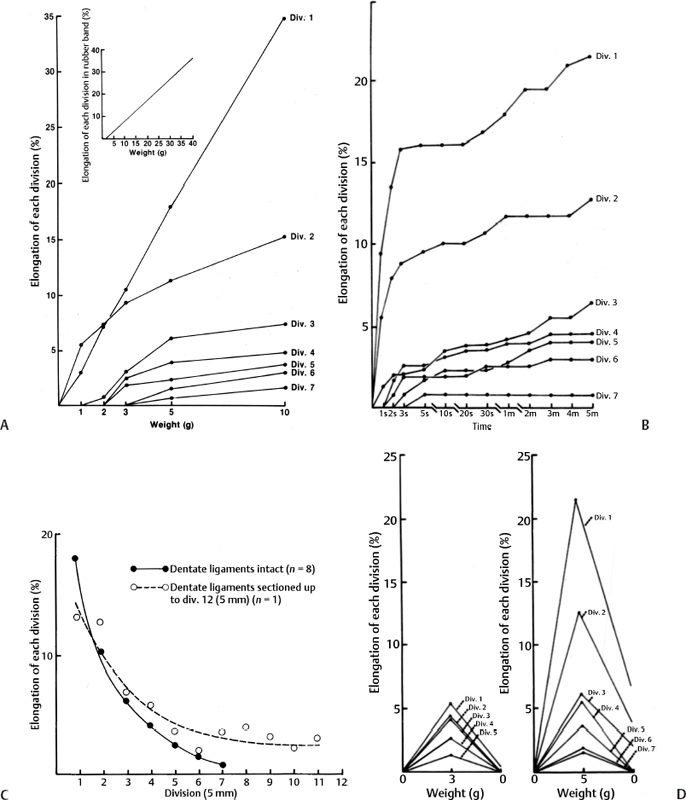
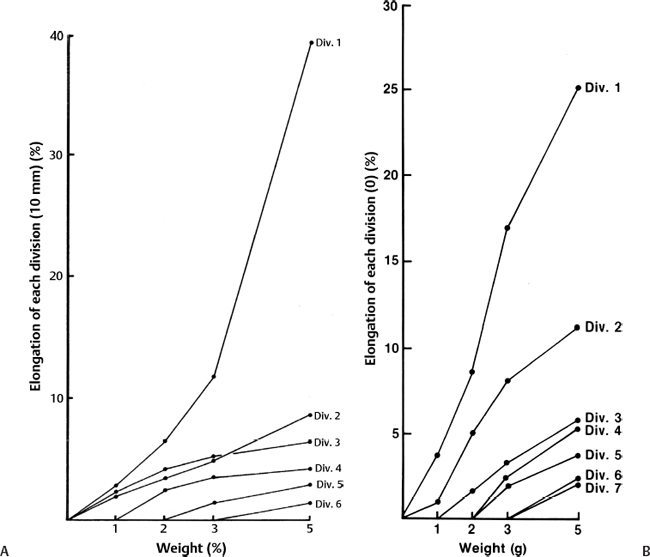
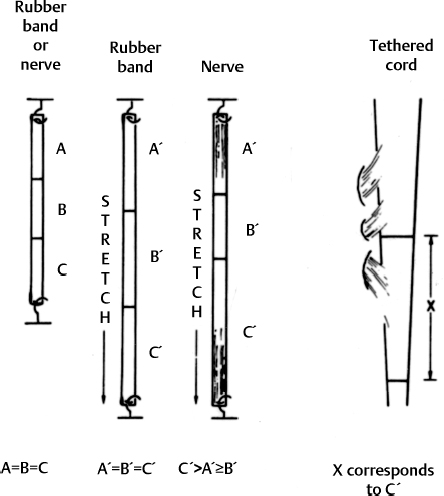
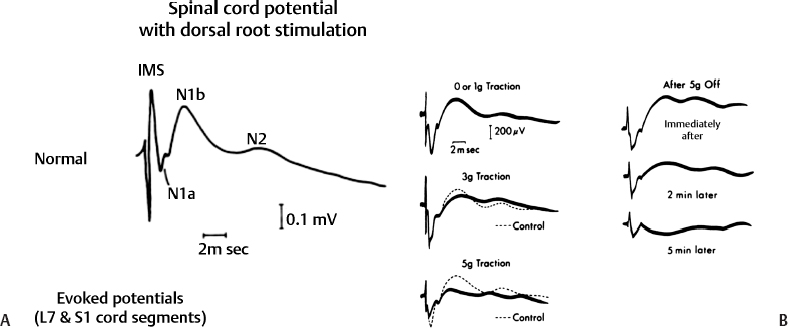
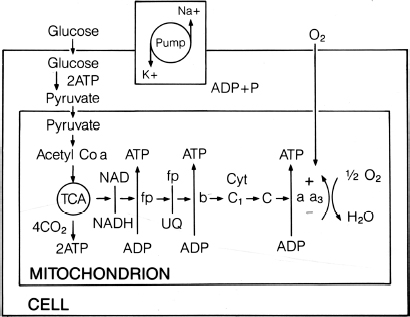
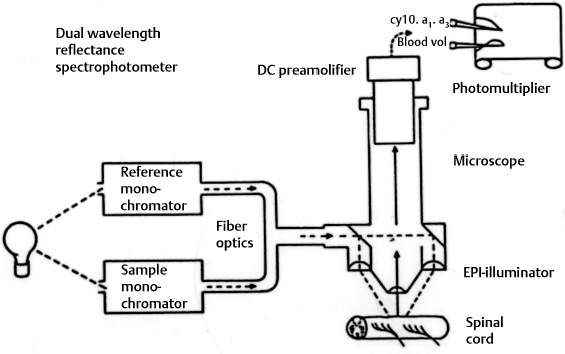
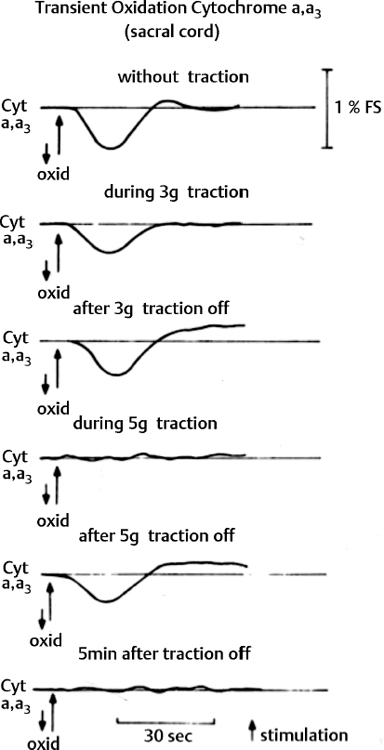
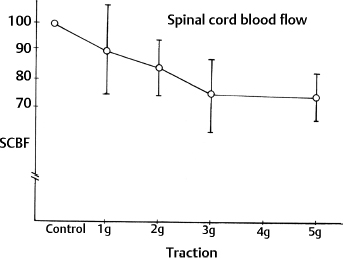
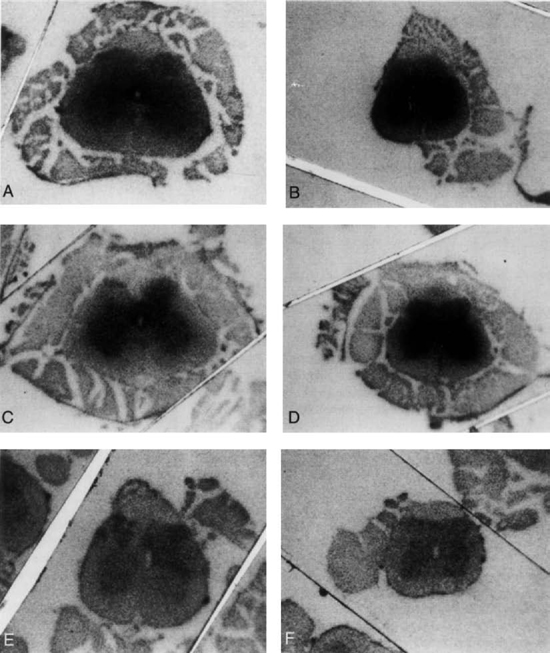
3 Pathophysiology of Tethered Cord Syndrome Shokei Yamada, Russell R. Lonser, Daniel J. Won, and Brian S. Yamada Tethered cord syndrome (TCS) is a stretch-induced functional disorder of the spinal cord with its caudal portion anchored by an inelastic structure. This chapter clarifies the reversible lesions that occur in the cord segments above any of the inelastic structures. In 1957 Hoffman et al localized the reversible lesion in the lumbosacral cord continuous to a thick filum and adopted the term “Tethered Spinal Cord.”1 In 1981, Yamada et al demonstrated impaired oxidative metabolism in the lumbosacral cord of patients with the same presentation and confirmed parallel metabolic and neurological improvement after untethering surgery.2 All the early signs were completely reversed by sectioning or resectioning of the inelastic filum. The concept of tethering-caused lesion originated from the surgical experience of various authors.2–29 However, such expressions as cord tethering and tethered cord encountered an earlier criticism by many neurosurgeons, for example, Frank Anderson (personal communication, 1985), as only descriptive and of nonscientific significance.28 To avoid controversies that could originate from unclear terminology Yamada and Won provided three pathophysiological categories.28 (1) true TCS, associated with an inelastic filum with or without cord elongation or filum thickening, caudal lipomyelomeningoceles (LMMCs) and sacral myelomeningoceles (MMCs), (2) a combination of the lesion above the cord fixation (TCS) and additional local lesion related to MMCs, or dorsal and large transitional LMMCs, (3) patients without typical signs and symptoms of TCS despite their anatomical appearance of cord tethering: first, those with complete paraplegia and incontinence, associated with MMC, or occasionally with large dorsal or transitional LMMC, indicating that no functional lumbosacral neurons exist; and second, asymptomatic patients with an elongated cord and a thick filum. This chapter concentrates on the pathophysiology of true TCS. Five basic questions have provided a focus for research on TCS and for clinical advances that have improved diagnosis and treatment. (1) What does tethering do to the spinal cord? (2) What is the mechanism of tethering-induced dysfunction? (3) Is tethering-induced dysfunction reversible? (4) Is the symptomatology of TCS reversible? (5) Are TCS lesions located in the gray matter or the white matter? (6) What is the role of cord elongation and thickening for TCS? Although the spinal cord substance is very soft, interlacing fibers of neurons, glia, and vasculature, supported by the pia mater, prevent separation between these structures under the stress of distortion. In addition, the dentate ligaments and the dura mater in the cervical and thoracic cord levels resist cephalad or caudad traction exerted to the spinal cord.30,31 When the traction force is applied at the caudal end of the spinal cord as seen in the patient whose spine is growing rapidly32 in the presence of an inelastic filum, no protection by the dentate ligaments and dura mater is available. Instead, viscoelasticity of the filum terminale prevents the cellular components of the cord from dysfunction and disruption. Thus the minor stretching of the spinal cord that occurs during normal movements33,34 is within the limits of tolerance,2 and normal lumbosacral cord function is maintained. Despite this protection, however, there are conditions in which further tension increases within the spinal cord and reaches a level sufficient to excessively stretch the cord. If the cord is stretched to moderate levels, functional changes may occur. If the stretching is more severe, lasting derangements in cord function may result. Insights into the causes and effects of excessive cord stretching have been derived from cat models of tethered spinal cord.34 Such experimental studies have provided useful information for spinal cord extensibility and the degree of stretching that can be tolerated. As reviewed in the following sections, studies in such models have resulted in a definition of the physiological and anatomical consequences of stretching the spinal cord, and the mechanisms of dysfunction produced by spinal cord tethering.2 Typical among studies of TCS in animal models were those in which tension was increased evenly (isotonically) in the various cord segments of cats by ligating the filum terminale and pulling the spinal cord and filum caudad in weight35 (Figs. 3.1, 3.2). Results of increasing cord traction in this manner included the following2,35: Fig. 3.1 Animal model of tethered spinal cord: The lumbosacrococcygeal cord was exposed through laminectomy. A ligature was placed around the filum terminale and then threaded over a pulley; various weights were attached to the other end. (From Yamada S, Zinke DE, Sanders DC. Pathophysiology of “tethered cord syndrome.” J Neurosurg 1981;54: 494–503. Reprinted with permission.) Fig. 3.2 (A) The lumbosacrococcygeal cord of cats was divided into 12 divisions of equal length (10 mm). The elongation of each division was measured during traction with various weights during 1 g to 10 g traction. (B) The ligature was placed at the caudal end of the spinal cord, 5 mm below, or 10 mm below. The graph shows the percentage of elongation of each segment during 5 g traction. The elongation varied depending on the location of the ligature. (C) In humans, the lowest pair of dentate ligaments is attached between the T12 and L1 cord segments, regardless of the length of the spinal cord. ([A] Reproduced from Tani et al49 with permission.) Fig. 3.3 Graphs showing the results in animal models of tethered spinal cord with a ligature placed at 5 mm below the caudal end of the cord. (A) The percentage of elongation of each cord division in cats. The percentage of elongation of division 1 (that includes a half filum and a half coccygeal cord) may be compared with that of a rubber band (insert). (B) The sequential elongation rate (rapidity of elongation) of each division during 5 g traction; s, seconds; m, minutes. (C) The percentage of elongation of each division during 5 g traction with the dentate ligaments intact and sectioned up to division 12 (traction was applied 5 mm below the attachment of the lowest coccygeal nerve). (D) The percentage of elongation of each division during 3 g traction (left) and 5 g traction (right) with a ligature placed at the caudal end of the spinal cord. Measurements were taken 5 minutes after the start of traction and 5 minutes after the release of traction. Fig. 3.4 Results of cord traction in animal models. (A) The percentage of elongation of each division (with a ligature placed 10 mm below the caudal end of the spinal cord) is shown in relation to weight increases. The elongation rate of the filum itself makes a steeper rise after the first linear increase beyond 3 g traction, indicating its viscoelasticity is greater than that of the rubber band. (B) The percentage of elongation of each division with a ligature at the caudal end of the spinal cord is shown. The lowest segment of the spinal cord (division 1) elongates 25%, suggesting that the human tethered spinal cord, anchored by the inelastic filum, elongates similarly. Note: the same segment that corresponds to division 2 in (A) elongates only 9% by the protection of the viscoelastic filum. Fig. 3.5 A rubber band and a bundle of cat sciatic nerve fibers were divided into three sections of equal length by markers. Elongation of each section was equal in the rubber band but varied in the nerve fibers, with the greatest elongation in the lower third and the shortest in the middle. Later, the middle section of the nerve fibers gradually elongates as other sections contract. The changes in length are partly due to viscosity and partly to probable contractility of the nerve fibers, similar to those of the spinal cord. (From Yamada S, Knierim D, Yonekura M, et al. Tethered cord syndrome. J Am Paraplegia Soc 1983;6: 58–61. Reprinted with permission.) If the untethering procedure can reverse the symptoms of TCS, tethering may produce electrophysiological dysfunction in the spinal cord that may not be necessarily accompanied by irreversible histopathology. As shown in the following sections, much effort has therefore been directed toward defining the physiological consequences of TCS. As usual in elucidating the pathophysiology of disease entities, studies to define the mechanisms of TCS have focused on animal models of this syndrome. An expected result from evidence linking TCS to electrical dysfunction was that, in cats, depression of electrical activity did accompany severe traction.36,37 For example, stimulation of the S2 and S3 roots produced shifts in interneuron potentials in the corresponding cord segments that were diminished during 3 g traction. These evoked potentials recovered after traction was released. In contrast, interneuron potentials were depressed almost to unrecognizable levels during 5 g traction, and recovery after traction release was only to ∼50% of control (Fig. 3.6). A significant finding also was that after the partial recovery of interneuron potentials following release of (5 g) traction, these potentials again nearly disappeared. This disappearance occurred coincidentally to the secondary changes in oxidative metabolism described below, suggesting a link between these activities. Fig. 3.6 (A) Evoked potential recordings at the L7-S1 cord segments in response to stimulation of the corresponding nerve roots. The intramedullary spike (IMS) is the first negative sharp wave, derived from the posterior column. The N1a, the second small negative potential, is derived from the afferent terminal. The N1b and N2 are interneuron potentials.43 (B) Recordings from the S2–3 segments show low potentials and delayed latency, more marked during 5 g traction than during 3 g traction. (From Yamada S, Zinke DE, Sanders DC. Pathophysiology of “tethered cord syndrome.” J Neurosurg 1981;54:494–503. Reprinted with permission.) A hypothesis of research at Loma Linda University has been that TCS impairs electrical and metabolic activities of neurons and that these impairments may be linked.2,38 Such a link is not unexpected because the central nervous system (CNS) relies almost entirely on oxidative phosphorylation of adenosine 5′-diphosphate (ADP) to provide the adenosine triphosphate (ATP) as previously mentioned39 (Fig. 3.7). One approach to understanding whether there is an oxidative metabolic consequence to TCS took advantage of the fact that reduction/oxidation (redox) shifts of the mitochondrial electron carriers (especially, the terminal carrier, cytochrome a,a3) can be recorded in lumbosacral cord tissues noninvasively by reflection spectrophotometry (Fig. 3.8). In particular, gray matter occupies greater than 90% of the lumbosacral cord, and both beams of light 590 nm and 605 nm used for this technology can reach readily to the mitochondria to elicit reflection from this cytochrome. In adapting this technology to monitor metabolic activities related to TCS, a difficulty was that the optical field to be studied was deformed by any procedure that moved or elongated the spinal cord, such as tethering or untethering procedures. To circumvent this complication, effects of spinal cord tethering in animal models and humans were evaluated by comparing redox shifts of cytochrome a,a3 under two types of stresses: (1) transient hypoxia, which provoked transient increases in reduction of cytochrome a,a3,2 and (2) stimulusinduced increases in neuronal activity.39,40 Fig. 3.7 The diagram shows high-energy production at three sites in the respiratory chain. Rapid electron transfer from nicotinamide adenine dinucleotide (NAD) to cytochrome a,a3 facilitates adenosine diphosphate (ADP) phosphorylation to produce adenosine triphosphate (ATP) where molecular oxygen is adequately supplied. Slow ATP use is associated with a low amount of ADP, which inhibits electron transport. TCA, tricarboxylic acid cycle; UQ, ubiquinone; P, inorganic phospher; fp, flavoprotein; a,a3, cytochrome a,a3; b, cytochrome b. These comparisons were made between control responses (prior to tethering) and responses during and after tethering. In response to hypoxemia, shifts toward reduction were diminished in tethered spinal cords. These results suggested that the cytochrome existed during tethering in a more reduced state.2 In an early study in cats, for example, weights (1 to 5 g) were applied to produce traction to the laminectomized spinal cord. Thirty seconds after the onset of traction, the animals were made hypoxemic for 2.5 minutes by increasing the fraction of N2O:O2 in the inspiratory gas mixture from 75% to 100% through a positive pressure ventilator. This was followed by inspiration of 100% O2 for 1 minute, then by inspiration of the control (3:1) ratio of N2O:O2. Two minutes after the animal inspired the control gas mixture, the traction was released. After a 30-minute period of spinal cord relaxation, another hypoxemic insult was given to the animal, without traction. Fig. 3.8 The dual wavelength spectrophotometer utilizes two beams of light: 590 nm and 605 nm. The 605 nm light is absorbed by cytochrome a,a3 and hemoglobin; the 590 nm light is absorbed by hemoglobin only. The amount of 590 nm and 605 nm beams absorbed by hemoglobin is exactly same; therefore 590 nm is used as a reference. The 605 nm beam is reflected from the mitochondria, the great majority of which are located in the gray matter. (From Yamada S, Zinke DE, Sanders DC. Pathophysiology of “tethered cord syndrome.” J Neurosurg 1981; 54:494–503. Reprinted with permission.) Redox shifts of cytochrome a,a3 in response to hypoxia varied with the degree of spinal cord traction (Fig. 3.9). Shifts toward reduction of this cytochrome during hypoxia under 1 g traction were not significantly different from those recorded under control conditions, but the reductive shifts were increasingly slowed and smaller as traction was increased from 2 g to 5 g. Fig. 3.9 A reduction of cytochrome a,a3 is shown by an upward deflection in the recording. Note the differences in reduction levels depending on the traction weight. Reduction with 1 g traction is the same as control. As the weight increases, the reduction level becomes lower, indicating that cytochrome a,a3 is basically more reduced and incapable of further reduction in response to hypoxic stress. Oxid, oxidation. (From Yamada S, Zinke DE, Sanders DC. Pathophysiology of “tethered cord syndrome.” J Neurosurg 1981;54:494–503. Reprinted with permission.) After 1 g, 2 g, 3 g, or 4 g traction was released, reductive shifts of cytochrome a,a3 during hypoxia were unchanged from control values. After 5 g traction was released, however, reductive shifts of this cytochrome during hypoxia remained slower and were lower in amplitude than control for more than 30 minutes. (Refer to the mechanisms of late manifestation of TCS in Chapter 15, “Tethered Cord Syndrome in Adults.”) These results suggest that traction increasingly shifted the baseline redox ratio of cytochrome a,a3 to a more reduced state. Extrapolation of the redox activity of isolated mitochondria41 suggests that the reduced state of mitochondria in a tethered spinal cord is due either to lack of oxygen supply or to diminished ATP use.41 The former of these mechanisms is usually associated with diminished ATP production,2,39,42 whereas the latter of these mechanisms would limit oxygen consumption because electron turnover within the respiratory chain is controlled by the phosphate potential (i.e., ATP/ADP + Pi). Because evoked potential amplitudes were also diminished by spinal cord traction, these results suggest that traction-induced electrical and metabolic changes occur in the interneurons that are located in the gray matter.2 In contrast, changes in light absorption from white matter are likely to be almost negligible. Interneurons were proved to be susceptible to anoxia and ischemia by electrophysiological43–45 and histological studies,46 indicating early involvement of the gray matter similar to TCS. A link between TCS and metabolic derangements is also suggested by responses to nerve root stimulation.37 In cats, such stimulation is normally accompanied by transient shifts toward oxidation of cytochrome a,a3 recorded at the spinal cord segments corresponding to the stimulated nerve roots.37 These oxidative responses to stimulation were altered when recorded during cord tethering in cats (Fig. 3.10). With 3 g traction, for example, the oxidative shifts in response to nerve root stimulation were decreased in amplitude by ∼33%. The amplitude of these responses returned to control levels after release of the traction. With 5 g traction, however, stimulation failed to produce oxidation of cytochrome a,a3. When the 5 g traction was released, nerve root stimulation again produced some oxidation of cytochrome a,a3, but the amplitude of this response was markedly decreased within several minutes. Fig. 3.10 Transient oxidation (oxid) of cytochrome a,a3 in the S2–3 cord segments is elicited by stimulation of the corresponding nerve roots, with less amplitude during 3 g traction and no response during 5 g traction. After release of 3 g traction, transient oxidation returned to normal. After release of 5 g traction, oxidation returned but its amplitude decreased markedly within several minutes. FS, full scale. To provide insight into TCS and into the apparent mitochondrial dysfunction produced by cord traction, blood flow was monitored on the dorsal surface of the cat spinal cord by hydrogen clearance.37 Blood flow decreased gradually as a traction weight was increased from 1 g to 2 g, then to 3 g (90%, 83%, and 75% or normal, respectively). However, blood flow was similar at 3 g and 5 g traction (Fig. 3.11). When the weights were released, blood flow returned to normal. These data are compatible with the suggestion that increased reduction of cytochrome a,a3 during mild to moderate traction is mediated, at least in part, by decreased blood flow and perhaps by a limited supply of oxygen to mitochondria. However, there was dissociation between blood flow and cytochrome a,a3 reduction with the high-grade (5 g) traction. The cytochrome became further reduced by this traction (versus reduction at 3 g traction), whereas blood flow was similar in each condition. This suggests that an additional factor modulates metabolic changes. In humans, Schneider et al22 showed that blood flow was lowered during tethering but was significantly increased after untethering. Neurological improvement followed untethering. It is likely that these human cases correspond to the experimental model of low- to moderate-grade traction. The experimental results of Kang et al47 and Turnbull et al48 suggested a similar circulatory and neurological relationship. Fig. 3.11 The graph shows the blood flow of the lumbosacral cord. A linear decrease in the spinal cord blood flow (SCBF) occurred from 0 g to 3 g traction, but the blood flow with 5 g traction was the same as with 3 g traction. Although the blood flow results suggest that tethering-induced effects may involve hypoxia, it is not yet possible to define whether hypoxia or decreased ATP use directly underlies the apparent change in mitochondrial activity during spinal cord tethering. Either of these mechanisms could explain why cytochrome oxidase was highly reduced and why this cytochrome was limited in its capability to become further reduced in response to declines in the fraction of inspired oxygen. Additional findings that suggest a link between spinal cord tethering and impairments in oxidative metabolism include the following: The data described above support the hypothesis that the pathophysiological mechanisms of neuronal dysfunction due to traction of the spinal cord involve an impairment of oxidative metabolism. This hypothesis was supported by findings that cytochrome a,a3 was more reduced in a tethered cord and that the cytochrome was reoxidized to levels comparable with the control condition, following untethering of the cord. These redox changes are apparently linked to cord tethering and likely indicate that mitochondrial electron transport, and therefore ADP phosphorylation, is less active in tethered spinal cords. Two mechanisms could underlie this more reduced mitochondrial state during cord tethering: (1) the oxygen supply is inadequate to maintain the cytochrome in its normal oxidized state; and (2) ATP utilization is slowed by tethering. Insights into the mechanisms of mitochondrial changes due to tethering were also derived in animal models by monitoring glucose metabolism via autoradiography. This technique is based on the fact that radioactive two-dimensional (2-D)-deoxyglucose can be injected into the body and then be taken up by cells, including those in brain, as glucose. The difference between glucose and deoxyglucose is that the latter cannot be isomerized to fructose-6-phosphate, and its metabolism ceases at this point in the glycolytic pathway. Fortuitously, the distribution volume and the plasma concentration of deoxyglucose can be determined by quantitative autoradiography.51 This procedure is quantitative because mathematical models allow calculation of local deoxyglucose uptake, which is related to local glucose utilization. Such procedures in the brain in vivo, for example, have confirmed the tight coupling between the functional state of a brain region, its local metabolic rate, and its blood flow. In studies of cord tethering performed at Loma Linda University, the spinal cords of anesthetized cats were subjected to either no traction (controls) or 3 g or 5 g traction, and 2-D-deoxyglucose (12 nCi/kg) was given intravenously. After 15 minutes, the animals were sacrificed, and the descending aorta was cannulated for perfusion with a glutaraldehyde/formaldehyde mixture. After fixation, the lumbosacral segments were removed and stored at -70°C. The frozen cords were later sectioned into 10 20 µm thick sections from the L7 and S2 cord segments. Autoradiography was performed by standard techniques.52 The films were developed and analyzed for relative glucose consumption using a densitometer (Fig. 3.12).
What Does Tethering Do to the Spinal Cord?
Extensibility of the Spinal Cord and Filum Terminale
What Is the Mechanism of Tethering-Induced Dysfunction?
Spinal Cord Evoked Potentials
Redox Shifts of Cytochrome a,a3

Spinal Cord Blood Flow
Glucose Metabolism
Stay updated, free articles. Join our Telegram channel

Full access? Get Clinical Tree


