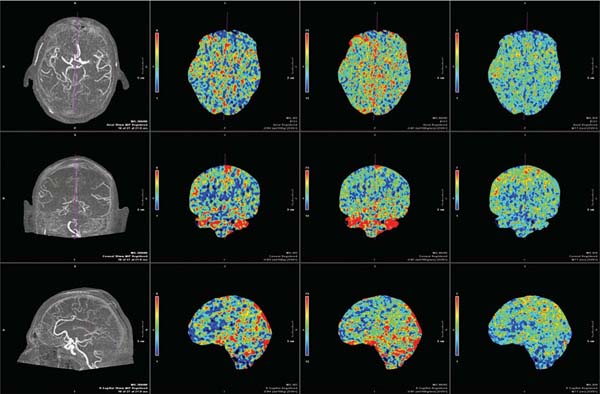
Chapter 23 The goal of physiologic imaging in cerebrovascular disease is to guide therapy toward preservation of functional brain tissue. Knowledge of the local metabolic needs of brain parenchyma is required to determine whether there is tissue at risk, realizing that certain cells in the brain have a higher adenosine triphosphate demand, such as neurons in the globus pallidus and parahippocampal gyrus, and thus are more sensitive to injury from deficient supply of oxygen and nutrients than are cells in other areas of the brain such as white matter tracts. Anatomic imaging from magnetic resonance imaging (MRI), computed tomography (CT), and angiography is able to provide accurate characterization of arterial or venous luminal disease. CT angiography continues to rapidly improve and is making a strong bid to replace diagnostic catheter angiography. Recent developments with 320–detector row scanners even provide temporal phases on CT angiography. However, this anatomic data fails to tell the story of how well brain tissue is getting the supplies it needs. Physiologic imaging is rapidly developing to fulfill this requirement by providing measurements of cerebral hemodynamics and cerebral metabolism. CT perfusion uses rapid intravenous (IV) bolus injection of iodinated contrast to acquire maps of cerebral blood flow, cerebral blood volume, and mean transit time, which can be used to determine tissue viability.1 These same maps can be obtained with MRI perfusion during the IV administration of a gadolinium contrast agent.2 These data can be compared with diffusion-weighted images to estimate ischemic core and penumbra size. A pharmacologic challenge with acetazolamide can be administered during either CT or MR perfusion to help determine cerebral blood flow reserve.3 This can help reveal the status of collateral blood supply. Certain MR sequences, such as arterial spin labeling, are available that can provide data on brain territories supplied by individual vessels and that can help define watershed zones, which shift with various cerebrovascular injuries.4,5 Nuclear medicine tests, especially positron emission tomography (PET), can also be used to directly measure physiologic parameters such as the regional metabolic rate of oxygen and glucose and the tissue oxygen extraction fraction (OEF).6 Physiologic imaging techniques will be reviewed in this chapter, with the focus on their practical use, including indications, interpretation, and potential pitfalls and artifacts. The main focus of the chapter is on CT perfusion, the tool currently being studied the most in a clinical setting. Acute stroke is the clinical context on which most research has been focused. Standard of care for acute stroke imaging remains a noncontrast head CT, as this determines whether contraindications to IV tissue plasminogen activator (tPA) exist; primarily hemorrhage, although infarct size greater than one third of the middle cerebral artery (MCA) territory also predicts increased risk of hemorrhagic transformation following IV tPA.7 Treatments for acute stroke approved by the U.S. Food and Drug Administration (FDA) are limited to IV tPA administered within 3 hours of symptom onset and use of the Mechanical Embolus Removal in Cerebral Ischemia (MERCI) device (Concentric Medical, Mountain View, CA) within 9 hours of symptom onset. Because of the arbitrary time cutoffs, many patients presenting with acute stroke are not eligible for treatments that may salvage oligemic brain tissue. One of the main goals of physiologic imaging is to determine which patients may benefit from treatments beyond the time windows. This can be achieved by determining whether a mismatch persists between the infarcted core and surrounding ischemic penumbra. This can be determined with either CT perfusion or MR perfusion studies.8 Clinical indications for the acetazolamide (ACZ) challenge study are to further stratify risk of infarction in patients with symptomatic or asymptomatic carotid artery stenosis or stroke risk in patients about to undergo cardiac or carotid surgery. The study may be a way to assess the effectiveness of collateral blood supply in these patients and in patients with moyamoya disease, and help determine who may benefit from extracranial-intracranial bypass surgery. MRI with diffusion-weighted images, MR perfusion, and MRA of the cervical and intracranial vessels provides essentially the same information as a CT scan of the head with CT angiography and CT perfusion. However, CT is much more accessible than MRI and is much faster, a critical concern when time is brain. Iodinated contrast is FDA-approved for CT perfusion, whereas gadolinium for MR perfusion is off-label; therefore, software companies have focused more on generating perfusion maps using CT. Also, the signal dropout on MR perfusion based on T2* effects which is used to generate perfusion maps is not linearly related to gadolinium concentration in the brain and therefore only relative, nonquantitative maps can be produced. There is a linear relationship of tissue contrast concentration and Hounsfield unit (HU) attenuation, allowing quantitative maps with CT. A limitation of CT perfusion is coverage. Whereas MR perfusion is of the whole brain, CT perfusion is limited by the width of the detector. This is because information is being collected from the same brain region rapidly over and over as contrast flows in and out, faster than the table can move. Therefore a 16-detector row CT scanner allows a 2-cm slab of data, which is typically reconstructed as two adjacent 10-mm-thick slices. A 64–detector row CT scanner can obtain a 4-cm slab, producing four 10-mm-thick adjacent slices. The positioning of these slices has to be chosen carefully, depending on what vascular territory is of interest. Newer 320–detector row scanners collect data over a 16-cm slab and thus can perform whole-brain CT perfusion (Fig. 23.1). Fig. 23.1 Whole-brain CT perfusion study performed using Toshiba’s Aquilon One (320-slice volume CT) shows normal mean transit time. Cerebral blood flow and cerebral blood volume color maps are shown in the axial, coronal, and sagittal planes. The images are displayed in MPR format and can be manipulated on the workstation.
Physiologic Imaging
 Background
 Indications
 Technique
Related posts:
 Venous Sinus Thrombosis Recanalization Techniques
 Extracranial Vertebral Artery Angioplasty and Stenting
Stay updated, free articles. Join our Telegram channel

Full access? Get Clinical Tree


