Patient no.
AHI
AHI supine
AHI non-supine
% supine position
Desaturation index
Baseline
After MMA
Baseline
After MMA
Baseline
After MMA
Baseline
After MMA
Baseline
After MMA
1
46,6
4,9
77,8
13,3
39,3
1,2
18,8
30,7
48,0
3,9
2
35,6
12,5
81,7
24,0
29,2
3,2
12,3
44,8
28,2
7,2
3
68,2
28,2
82,0
31,0
48,4
4,6
59,1
89,3
53,0
25,0
4
82,2
40,9
88,8
69,1
71,8
22,6
62,2
39,3
75,6
13,6
5
38,2
24,0
53,2
49,3
33,1
9,4
28,2
36,5
27,1
19,1
6
50,7
14,9
86,5
28,0
30,8
3,8
35,8
45,9
52,9
14,4
7
64,1
20,6
76,0
36,9
54,4
0,6
45,7
53,4
62,9
17,7
8
66,9
14,8
64,1
18,1
82,1
3,8
84,7
78,0
69,4
9,2
9
57,0
27,0
60,2
62,4
49,1
2,5
70,7
40,9
48,6
22,3
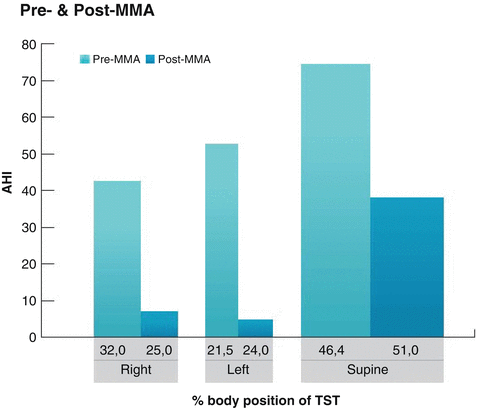
Average follow-up interval for the second PSG recording was 5.9 ± 3.9 months after surgery. Table 2 shows the averages of the polysomnographic results pre and post MMA. A significant decrease in all polysomnographic parameters was seen following MMA surgery. However, the mean supine AHI was still >30. The mean supine AHI decreased from 74.5 to 36.9; this is a reduction of 50.5 %. The mean AHI in lateral sleep positions both decreased even more: right sleep position 42.4–7.0 (83.5 %) and left sleep position 52.7–4.8 (90.9 %). These results are shown in Fig. 1. The BMI did not change significantly postoperatively.

Table 2
Comparison of pre- and post-MMA results
Characteristics | Pre Mean ± SD | Post Mean ± SD | Wilcoxon signed-ranks p-value |
|---|---|---|---|
BMI | 28.3 ± 3.3 | 27.3 ± 3.3 | 0.123 |
Total AHI | 56.6 ± 15.3 | 20.9 ± 10.6 | <0.01 |
Total AHI supine | 74.5 ± 12.4 | 36.9 ± 19.5 | 0.01 |
Total AHI non-supine | 48.7 ± 18.4 | 5.7 ± 6.8 | <0.01 |
Desaturation index | 51.7 ± 16.6 | 14.7 ± 7.0 | <0.01 |

Fig. 1
Pre- and postoperative results of MMA
The patients’ dental characteristics are shown in Table 3. Different parameters of the MMA are demonstrated per patient. The pharyngeal airway space (PAS) is defined as the smallest airway space measured on a lateral cephalogram in millimeters pre- and postoperatively. All patients have an increased PAS after MMA with a mean increase from 6.1 to 13.6 mm. The advancement of the maxilla is shown in the cephalometric angle between point sella, nasion, and frontal bone of the maxilla, defined as SNA in amount of degrees. All patients have an increased angle after MMA with a mean of 82.6–88.1°. The advancement of the mandible is measured on a panoramic radiograph and has a mean increase of 8.2 mm after advancement.
Table 3
Polysomnographic and clinical variables of the study group
Patient no. | PAS in mm | Advancement SNA angle | Advancement mandible | ||
|---|---|---|---|---|---|
Baseline | After MMA | Baseline | After MMA | Baseline | |
1 | 4 | 14 | 88 | 102 | 11 |
2 | 6 | 10 | 79 | 89 | 8 |
3 | 7 | 12 | 82 | 87 | 8 |
4 | 4 | 10 | 84 | 85 | 7 |
5 | 8 | 24 | 90 | 94 | 10 |
6 | 5 | 15 | 79 | 85 | 7 |
7 | 4 | 12 | 78 | 85 | 5 |
8 | 10 | 13 | 83 | 84 | 10 |
9 | 7 | 12 | 80 | 82 | 8 |


