Fig. 7.1
Average AEPs for one exemplar control subject in response to standard and duration-deviant sounds (black and red lines, respectively) at five fronto-central electrodes. Voltage topographies at ~100 ms after stimulus onset exhibit prototypical N100 configurations with central negativity, for both standard and deviant sounds. The occurrence of the first negative difference between deviant and standard sounds and corresponding voltage topographies is observed at a typical MMN latency, between 150 and 200 ms. The white and black dots on the topographies represent the position of the minimum and maximum values across the whole electrode montage, respectively
While MMN is mostly informative with regard to automatic processing of auditory regularities at the level of individual sounds, other more complex paradigms examine auditory processing at the level of groups of sounds (Bekinschtein et al. 2009). In this case, a regularity is established over few seconds, by repeating groups of five sounds and replacing them from time to time with deviant ones. The detection of a rare group of sounds at the neural level is much more demanding than the detection of a single sound, for example, in an MMN protocol, as the former requires subjects to be aware of the regularity, while the latter is thought to be more automatic (Bekinschtein et al. 2009). This more complex paradigm has therefore been linked to conscious processing, as previous studies have shown that the majority of patients who can detect this type of irregularity are either at a minimally conscious level (Bekinschtein et al. 2009) or eventually regain consciousness (Faugeras et al. 2012).
Other auditory paradigms that have been well studied in patients with impaired consciousness are based on oddball protocols (Sutton et al. 1965; Friedman et al. 2001). Oddball paradigms consist in repeating one standard event, typically a sound, and intermixing it with unexpected target or salient stimuli. In healthy subjects, the target stimulus elicits the so-called P300 response (see also Chaps. 9 and 11), a positivity on central electrodes occurring about 300 ms after the stimulus onset (Sutton et al. 1965). The difference between P300 and MMN is that the former typically requires the subject’s attention or is associated with a highly salient event or a future action (Friedman et al. 2001). Moreover, the peak of the P300 response appears at later latencies as compared to the MMN (i.e., around 300 ms vs. ~150 ms poststimulus onset). Interestingly, a P300 response has also been reported during sleep (Pratt et al. 1999; Ruby et al. 2008) and even in coma, provided that the target stimuli are sufficiently salient (Signorino et al. 1995). Therefore, most studies have used neutral sounds as the standard stimulus, intermixed with the patient’s own name as the target stimulus, due to its high saliency for the patient (Signorino et al. 1995; Fischer et al. 2008; Holeckova et al. 2008). In clinical conditions, a P300 is assessed at the level of the single electrode as an amplitude modulation over central regions and is typically found in about 40 % of comatose patients, tested on average at 20 days after coma onset (Fischer et al. 2008). The presence of a P300 response in these conditions correlates with the patients’ chances of awakening (around 85 % specificity for awakening (Fischer et al. 2008). However, when patients are in a vegetative or minimally conscious state several months after coma onset, the chances of detecting a P300 response become considerably lower (about 25 %; Fischer et al. 2010). This possibly reflects a long-term degeneration of attention-related processes in those patients who do not manage to recover and fully regain consciousness.
Other cognitive ERP paradigms that have been tested in unconscious patients are based on linguistic material and test neural responses to semantic or phonetic incongruencies (Kutas and Hillyard 1980). Such paradigms, in healthy controls, typically elicit an N400 component, appearing about 400 ms after the incongruency onset (Perrin and Garcia-Larrea 2003), and it can be elicited even in passive listening (Perrin and Garcia-Larrea 2003). Among patients with severe disorders of consciousness, the N400 has been mostly, but not exclusively, observed in patients with some minimal consciousness (Schoenle and Witzke 2004).
To summarize, the presence of ERP components related to novelty detection or semantic processing is likely to indicate a favorable outcome for comatose patients, but none of them seems robust enough to be used as a reliable predictor in a clinical environment. Before introducing them into routine clinical practice, it is imperative that they have practically no false-positive answers and that they have been validated in large cohorts of patients. One of the main potential candidates for implementing a test for prediction of awakening is the MMN.
7.3 Mismatch Negativity in Clinical Practice
Despite the extensive literature linking the presence of an MMN to the patient’s chance of recovery (Kane et al. 1993; Fischer et al. 2004; Naccache et al. 2005; Wijnen et al. 2007) with a predictive value for awakening that far exceeds other paradigms, the use of MMN protocols in clinical practice has so far been rather limited. We believe that one main reason is the difficulty in assessing its presence at the individual level. Most previous studies assessing MMN in clinical studies rely on the estimation of the presence of an evoked activity at the level of AEP measured at a single-electrode level (Fischer et al. 1999, 2004). This assessment is based on the presence of the so-called N100 component (Hillyard et al. 1973), a negative deflection in the average AEP appearing over fronto-central electrodes, considered an “obligatory” marker of auditory processing at the level of the primary auditory cortices (Naatanen and Picton 1987). The estimation of this component relies on a somewhat subjective threshold regarding how this modulation should differ from an average baseline and has systematically implied the rejection of about 30 % of patients (e.g., in Fischer et al. 1999). Not only does this approach imply the rejection of patients who do not show any sign of intact auditory processing, but also, and more problematically, it implies the exclusion of patients exhibiting AEPs with poor signal-to-noise ratio, a situation occurring quite often in a clinical setting with many sources of electromagnetic noise (see also, e.g., Faugeras et al. 2012) (see also Chap. 2). As a consequence, MMN results based on including those patients who exhibit an N100 response are possibly biased by restricting the analysis to AEPs with a high signal quality and therefore more likely to also exhibit differential activity in response to different kinds of sensory stimuli. In addition, one should consider that AEPs in comatose patients are likely to be different from the stereotypical waveforms that can be measured in healthy subjects and also likely to vary among patients (see the ERPs in response to standard and deviant sounds in a control subject in Fig. 7.1 and a comatose patient in Fig. 7.2). Therefore, the validity of using the N100 component at the typical latency of average AEP measured in the healthy population can be limited, providing a second potential source of biased inclusion of patients exhibiting AEP similar to healthy subjects.
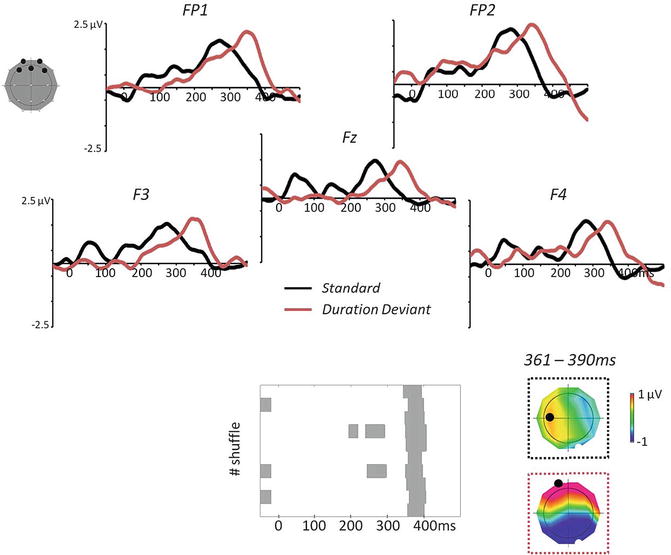
Fig. 7.2
Average AEPs in five fronto-central electrodes in response to standard vs. duration-deviant sounds and decoding results for an exemplar patient during the first 24 h of coma and under therapeutic hypothermia after cardiac arrest. The multivariate decoding algorithm provides a data-driven estimation of periods of differential activity across several data shuffles, as shown in the bottom panel. For this exemplar patient, the common periods of differences across all shuffles started around 360 ms and lasted up to ~390 ms poststimulus onset. The voltage topographies shown on the right are the ones observed in response to standard vs. deviant sounds during this period (the white and black dots on the topographies represent the position of the minimum and maximum values across the whole electrode montage, respectively)
Improving the assessment of an evoked activity and of a differential response in auditory paradigms would be extremely worthwhile: in clinical practice, the potential utility of MMN as a marker of good prognosis is enormous (Kane et al. 1993; Fischer et al. 2004; Luaute et al. 2005; Naccache et al. 2005; Wijnen et al. 2007; Tzovara et al. 2013). Its routine application during acute coma would potentially enhance the possibility of informing relatives and caregivers of the patient’s prospects, as early and as accurately as possible; the second aspect to consider is economic since intensive care support is an expensive practice needing to be sustained and motivated by demonstrating its utility for the patients; finally, increasingly accurate information about the patient’s early state could pave the way to optimizing rehabilitation care according to individual situations. Below, we will outline a method and a set of results providing an alternative to the classical estimation of the N100 and MMN response based on ERPs at the level of single electrodes.
7.4 Multivariate Decoding for Assessing Auditory Discrimination
An ideal approach for acute coma patients would be tailored to the individual and provide timely information. Patients can exhibit highly heterogeneous patterns of activity and present various degrees of coma severity and different forms of brain damage. The assessment of a reliable response to auditory and sensory stimuli in general should therefore flexibly adapt to the pattern of response of each individual without specific inclusion criteria based on knowledge gathered in the healthy population. Moreover, there is an increasing need for quantitative evaluation of sensitive markers of intact neural functions in a context where the vast majority of the tests are based on prediction of poor outcome (Bouwes et al. 2009; Rossetti et al. 2010). The implementation of multivariate decoding at the level of single-trial EEG offers a possible solution for an unbiased evaluation of AEPs at the single-patient level (Tzovara et al. 2013).
Multivariate decoding methods are increasingly used in neuroimaging studies (Pereira et al. 2009; Weil and Rees 2010; Blankertz et al. 2011), presenting several benefits over univariate approaches. First, the framework of implementation of these techniques typically offers a clear separation between discovering a discriminative pattern in one set of data and then testing on a separate set of observations (Kriegeskorte et al. 2009). Second, multivariate decoding has turned out to be particularly sensitive in comparison to univariate analysis when the discriminative patterns between experimental conditions range across voxels in functional magnetic resonance imaging (Staeren et al. 2009) or several temporal windows and electrode positions in EEG measurements (Hausfeld et al. 2012). Third, it can typically be optimized by allowing a parameter selection that best adapts to the signal of specific patients without assuming specific a priori hypotheses about the type of response (De Lucia et al. 2011; King et al. 2013). Fourth, decoding algorithms naturally deal with single-trial information and therefore allow the exploration of events occurring at different latencies with respect to stimulus onset; this is in contrast to average ERP, which keeps only time-locked activity to stimulus onset (De Lucia et al. 2012). Many multivariate decoding algorithms rely on the extraction of optimal features in the signal that allow the best discrimination between experimental conditions (Lemm et al. 2011). Sometimes, this feature-extraction stage relies on well-known phenomena characterizing a specific process (De Vos et al. 2012). Many other attempts in the literature for developing optimal strategies of decoding rely on a blind search for features or combinations of the EEG signatures within a set of possible alternatives (Bourdaud et al. 2008; Murphy et al. 2011). The main drawback is obviously the difficulty of interpreting, from a neurophysiological perspective, what insight one gains by finding optimal class separation between experimental conditions. One proposition lies halfway between a blind search for combinations of optimal features and the adoption of some flexibility in the decoding strategy, while still allowing interpretation (Philiastides and Sajda 2006; Simanova et al. 2010). In this chapter, we illustrate a single-trial topographic analysis (Tzovara et al. 2012a, b) and its application in coma research (Tzovara et al. 2013).
This method is based on voltage topographies as measured time point by time point in continuous recordings. The main goal is to extract configurations in the voltage topographies occurring at latencies where the two experimental conditions of interest tend to differ. Discovering such voltage configurations provides information on the underlying distribution of active sources in the brain. Indeed, within each recording and at the level of each patient, occurrence of a different configuration at the topographic level can be interpreted as resulting from a difference at the level of brain regions and by extension of brain regions involved in stimulus processing (Murray et al. 2008). Discriminative voltage configurations can occur at several latencies, even when one could not assume a reliable presence of an evoked activity. In this type of method, we take advantage of possible distributed activity along one or several time windows of different length and appearing at variable latencies. The discovery of the latencies at which two experimental conditions tend to differ is also informative, as typical basic sensory processing occurs early in time (i.e., <150 ms), while processes characterized by increasing complexity and refinement happen at subsequent stages. The co-occurrence of more than one time period of differential activity can also be informative as regards the existence of multiple levels in the process of a specific class of stimuli (De Lucia et al. 2012).
Single-trial topographic analysis foresees the existence of prototypical voltage configurations in relation to event-related activity at the level of the single EEG response. If these configurations exist and differ between experimental conditions, then the decoding algorithm should exhibit a significant decoding performance when classifying new independent trials as belonging to one of the two conditions. This method consists of three main steps; in the first, the algorithm learns a discriminative pattern across several possible combinations of the models’ parameters; in the second, the optimized algorithm is tested about providing similar decoding performance on trials independent of those used for estimating and optimizing the models; the third step consists of assessing the significance of the obtained results. This can be carried out at the level of each single patient/recording; this level of analysis entails the estimation of a null distribution for the decoding value in a specific setting (i.e., after relevant parameter selection). The estimation of such a distribution is somewhat standard in classical applications of machine-learning techniques and decoding methods in neuroimaging studies and entails training several models across several label randomizations in the training dataset. The real decoding performance can then be compared by nonparametric tests to the distribution of the values obtained for the randomized version of the decoding algorithm (Pereira et al. 2009).
7.5 Auditory Event-Related Potentials in Early Coma
Clinical tests are usually repeated for several days in comatose patients in order to detect possible improvements over time (Kane et al. 1993). However, the vast majority of the literature on ERP reports the results related to a single measurement for each patient. In addition, these studies include subjects recorded at various delays after coma onset (Fischer et al. 2004; Naccache et al. 2005; Boly et al. 2011). These factors contribute to producing a body of evidence that may lead to an incorrect conclusion, especially regarding the absence of specific responses.
Recently, the importance of carrying out ERP recordings over several days in comatose patients after a cardiac arrest was emphasized by a study conducted in a group of postanoxic patients, assessed using a standard, clinical 10–20 montage with 21 electrodes (Tzovara et al. 2013). These results have shown that the degree of auditory discrimination can change over time, as it can already be detected with a time delay of one day between the two recordings (Figs. 7.3 and 7.4a). In Fig. 7.4, the average decoding performance is grouped with respect to the outcome and timing of the recording (during TH and normothermia –NT respectively), regardless of whether patients exhibited significant results individually. A visual check of these average decoding values provides initial insight into the overall level of auditory discrimination in the different groups and, most importantly, provides qualitative evidence of the relatively higher performance of patients with poor outcomes during TH (Fig. 7.4a). This pattern of results was first discovered in a pilot group of patients and then confirmed in an independent validation group, without any knowledge about patients’ outcome. The higher decoding value at group level was also reflected in the degeneration of decoding performances from TH and NT in all the patients who later died (Fig. 7.4b). At the level of each single patient, the progression of the degree of auditory discrimination over time was highly informative regarding the patients’ chances of survival, as only those who later survived improved their performance from TH to NT (Fig. 7.4b): across thirty patients this test provided a 100 % positive predictive power of survival and awakening within 3 months.
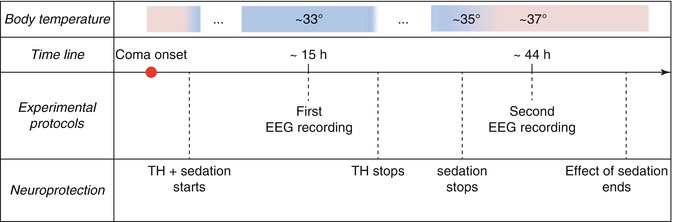
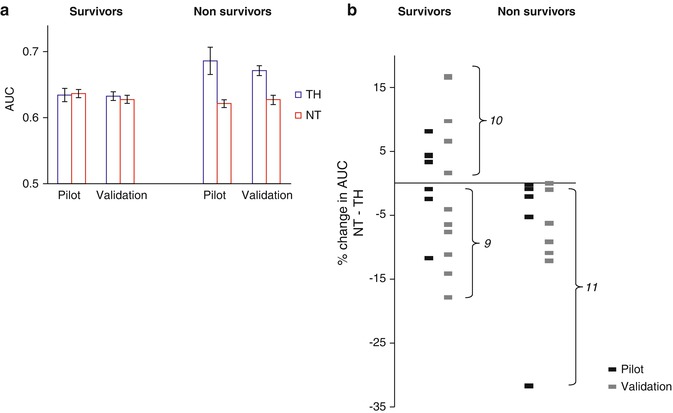
Fig. 7.3
Timeline of EEG recordings in correspondence to the various stages of sedation and TH, with corresponding patient body temperatures, as reported in Tzovara et al. 2013
Fig. 7.4
(a) Decoding performance between standard and deviant sounds in two groups of postanoxic comatose patients (pilot and validation), grouped with respect to outcome and time of the recording (TH and NT); the highest decoding performance was obtained during TH for patients who later died and was followed by a decrease during NT, in both pilot and validation groups of patients. (b) Percentage of difference in the decoding performance between NT and TH, grouped with respect to outcome. An increase in decoding performance was only observed in a subgroup of survivors (100 % predictive power for survival and awakening at 3 months) (Data from Tzovara et al. 2013)
A major advantage of this approach is that the multivariate decoding algorithm did not require any preselection before analyzing individual patients’ data. Provided that these results based on multivariate decoding are confirmed in a larger population, they encourage the implementation of this experimental protocol in clinical practice, where this test could complement existing ones, which so far mostly provide information about poor outcomes (Rossetti et al. 2010) (see Chaps. 5 and 6).
Related posts:
 Brain-Computer Interface for Assessing Consciousness in Severely Brain-Injured Patients
The Chronic Clinical Setting
Brain-Computer Interface for Assessing Consciousness in Severely Brain-Injured Patients
The Chronic Clinical Setting
 Event-Related Potentials in Disorders of Consciousness
 Prognostic Use of Somatosensory Evoked Potentials in Acute Consciousness Impairment
 EEG in Refractory Status Epilepticus
 Prognostic Utility of Electroencephalogram in Acute Consciousness Impairment
Stay updated, free articles. Join our Telegram channel

Full access? Get Clinical Tree


