Quantitative Sleep Monitoring Methods
Paul R. Carney
William Ditto
Sachin Talathi
Paul G. Cox
James D. Geyer
INTRODUCTION
Sleep is a major part of everyone’s life and has been studied thoroughly. Sleep is composed of nonrapid eye movement (NREM) sleep and rapid eye movement (REM) sleep. NREM sleep is further broken down into four stages. In this chapter, we discuss much of the terminology that is used in polysomnography as well as some of the techniques and issues involved in recording polysomnographic data. The physiological characteristics that are measured by polysomnography as well as how they differ throughout the various sleep stages are explained. In addition, some of the quantitative characteristics of polysomnography are discussed. Techniques that try to automatically detect the sleep stage based on these quantitative characteristics are also reviewed.
QUANTITATIVE POLYSOMNOGRAPHY
Polysomnography includes recording of electrical activity that represents specific physiological characteristics during sleep. It can be made up of bioelectrical potentials, transduced signals, and signals that are derived from ancillary equipment (1).
The electroencephalogram (EEG), the electrooculogram (EOG), and the electromyogram (EMG) are some of the devices used to obtain measurements during polysomnography. These measurements can be used for sleep state detection. Each of these devices monitor different physiological characteristics: the EEG measures brain activity, the EOG measures eye movement, and the EMG measures muscle activity. Each device gives insight into the stage of sleep.
EEG: According to the Rechtschaffen and Kales (R&K) (2) sleep staging system, certain bandwidths appear or disappear within the EEG signal depending on the sleep state that the patient is in. In addition, certain neurophysiological activity (e.g., sleep spindles and k-complexes) can be used to distinguish the stage of sleep from the EEG.
The main points of the R&K classification (2) system were discussed previously. In summary, during wakefulness, alpha activity exists as well as low-voltage, mixed-frequency activity. The alpha waves exist in the wake state and decrease when the patient enters stage N1 NREM sleep. Sleep spindles and K complexes are an indication of stage N2 NREM sleep. Then, delta waves appear in stage N3 NREM sleep. Finally, theta waves suggest REM sleep (3).
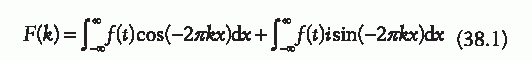
Although a visual inspection of the EEG signal can be an indicator of the frequencies that make up the signal, a clearer representation of the frequencies can be achieved by transforming the signal into the frequency domain by using the Fourier transform. The Fourier transform is a mathematical technique that can transform any time series into a spectrum of the frequencies that produce it. It is a generalization of the Fourier series that breaks up any time-varying signal into the frequency components of varying magnitude that make it up. The Fourier transform is defined in Eq. 38.1 where f(t) is any complex function and k is the kth harmonic frequency.
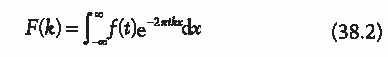
Based on Euler’s formula, this can also be written as shown in (38.2).
Any time-varying signal can be represented as a summation of sine and cosine waves of varying magnitude and frequencies (3). The Fourier transform is represented
with the power spectrum (or spectral density). The power spectrum has a value for each harmonic frequency that indicates how strong that frequency is in the given signal. The magnitude of this value is calculated by taking the modulus of the complex number that is calculated from the Fourier transform for a given frequency (|F(k)|).
with the power spectrum (or spectral density). The power spectrum has a value for each harmonic frequency that indicates how strong that frequency is in the given signal. The magnitude of this value is calculated by taking the modulus of the complex number that is calculated from the Fourier transform for a given frequency (|F(k)|).
Once the EEG signal has been transformed to the frequency domain using the Fourier transform, the actual frequencies that create the original signal can be noted. The existence (or lack thereof) of certain bandwidths can then be used to determine the stage of sleep that the patient was in at the time the EEG segment was recorded. Alpha waves (8-13 Hz) are an indication that the patient is in the wake state or stage 1 of NREM sleep. Delta waves (<4 Hz) are an indication of being in stage 3 NREM sleep. Theta waves (4-7 Hz) are an indication of REM sleep.
EOG: The EOG measures the potential difference between the front and back of the ocular globe and is able to detect movements of the eyes (4). The eye movement is an indication of whether the patient is in the REM sleep stage or NREM sleep. When in stage N1 of NREM sleep, slow eye movements (SEMs) appear and are usually gone by stage N2 of NREM sleep. NREM stage N3 does not contain any eye movement in the normal patient. REMs, which appear as much sharper impulses, appear in wakefulness and REM sleep. The frequency of the eye movements can also be shown by transforming the EOG channel into the frequency domain using the Fourier transform. The presence of SEMs is indicated by the high spectral values in the lower frequency ranges. Epochs of REM sleep exist that do not contain REMs. These are referred to as tonic REM sleep.
EMG: The EMG measures the potential difference of electrodes placed on the chin and indicates the chin’s muscle tone (5). There are high levels of activity when the patient is awake. However, this activity decreases when the patient is in NREM sleep, and the activity almost disappears once the patient enters the REM sleep stage. A decrease in the amount of activity in the EMG can be seen as the patient progresses to REM sleep.
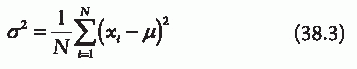
A sliding window variance analysis could be used to show the decrease in EMG activity. The variance for a given set of points is defined as in Eq. 38.3 where µ is the mean of the sampled points. At a given time t, a sliding window variance analysis calculates the variance for all points sampled within the last T seconds, where T is some preset constant of time.
The polysomnograph has been used for sleep stage detection since R&K published the standardized manual (2). It contains different physiological measurements, such as the EEG, the EMG, and the EOG, which can be used to facilitate the classification process. The actual classification is done by identifying certain characteristics with the signal itself, such as frequency bands in the EEG, eye movement frequency in the EGG, and the amount of muscle movement in the EMG.
ADVANCED EEG MONITORING
The process of manually categorizing a segment polysomnographic recording into its respective sleep state classification is long and tedious. Any technique that could automatically detect sleep states would be very beneficial in clinical practice and research.
Various techniques have been presented to try and either automatically detect sleep states or at the very least to assist in the classification process. When a technician manually classifies an epoch into its respective sleep stages, the EMG and EOG are mainly used to facilitate the classification of sleep into REM or NREM sleep. However, each stage of sleep has distinct characteristics specific to the EEG, and therefore classification could be done on the basis of the EEG alone. The majority of these techniques use only the EEG signal. The stages of the R&K sleep state classification system can usually be distinguished by considering the bandwidths of the waves that form the EEG signal or by looking for specific waveforms within the signal, for example, k-complexes and sleep spindles. Because of this, the majority of sleep stage detection methods involve a time—frequency analysis of the EEG signal, or in certain cases, some other signal of the polysomnograph. Nonlinear analysis of the EEG for sleep stage detection has also been used (6,7); however, Shen et al. have shown that there are weak nonlinear signatures in the sleep stages of the EEG, which is an argument for using linear methods (8). Techniques that are used include a spectral analysis (9), a wavelet analysis (10), and matching pursuit (11). The following sections discuss some of the more recent time—frequency analysis techniques that are used to automatically detect the sleep state from EEG by using the aforementioned approaches.
WAVELET ANALYSIS
Wavelet analysis is a generalization of the short-term Fourier transform that allows for basis functions that are more general than a sine or cosine wave. Rather than considering certain frequency bands present in a given stage of sleep, these can be used to determine the existence of certain physiological waveforms (k-complexes or sleep spindles) that are introduced in certain stages of sleep (10,12). Akin and Akgul (12) attempted to detect sleep spindles by using a discrete wavelet transform.
The discrete wavelet transform is similar to the Fourier transform in that it will break up any time-varying signal into smaller uniform functions, known as the basis functions. The basis functions are created by scaling and translating a single function of a certain form. This function is known as the mother wavelet. In the case of the
Fourier transform, the basis functions used are sine and cosine waves of varying frequency and magnitude. Since a cosine wave is just a sine wave translated by π/2 radians, the mother wavelet in the case of the Fourier transform could be considered to be the sine wave.
Fourier transform, the basis functions used are sine and cosine waves of varying frequency and magnitude. Since a cosine wave is just a sine wave translated by π/2 radians, the mother wavelet in the case of the Fourier transform could be considered to be the sine wave.
However, for a wavelet transform the basis functions are more general. The only requirements for a family of functions to be a basis are that the functions be both complete and orthonormal under the inner product. Consider the family of functions, Ψ = {Ψij | -∞ < i, j < ∞}, where each i value specifies a different scale and each j value specifies a different translation based on some mother wavelet function. Ψ is considered to be complete if any continuous function f, defined over the real line, x, can be defined by some combination of the functions in Ψ as shown in Eq. 38.4 (1).
Related posts:


Stay updated, free articles. Join our Telegram channel

Full access? Get Clinical Tree


