Fig. 12.1
Four grades of leukoaraiosis according to Brant-Zawadzki’s classification in 4 different patients. Grade 1 a occasional frontal periventricular hyperintensities. Grade 2 b hyperintensities visible in the occipital horns. Grade 3 c diffuse periventricular nonconfluent hyperintensities. Grade 4 d confluent and diffuse periventricular white matter hyperintensities
Multiple Sclerosis (Fig. 12.2)
Inflammatory disease of the central nervous system characterized by demyelinating lesions of the white matter affecting young subjects (age of onset generally between 20 and 40 years), mainly women. The first episode of multiple sclerosis (MS) can sometimes be mistaken for an infarct, as it can sometimes have a sudden onset (symptoms generally progress over several days or sometimes several hours).
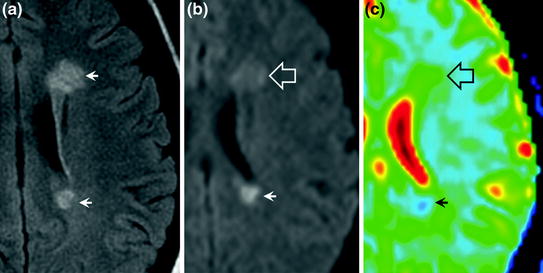
Fig. 12.2
Multiple sclerosis on MRI. Two lesions appear hyperintense on FLAIR images (a arrows). On diffusion-weighted images, they have different appearances: one lesion is hyperintense (b arrow) with decreased ADC (c arrow) and the other lesion is isointense (b hollow arrow) with an increased ADC (c hollow arrow)
Imaging
MRI
No grey matter lesions (cortex and basal ganglia). Isolated white matter lesion, predominantly supratentorial. Old lesions present a normal or increased ADC, while recent (active) lesions can present a decreased ADC. Oval-shaped (rather than rounded) hyperintensities, often multiple, with a long axis perpendicular to the ventricles are observed on T2-weighted and FLAIR images.
Frequent involvement of the corpus callosum and cervical spine (cervical MRI should be performed when in doubt). Possible contrast enhancement of recent plaques.
Tumours
Progressive onset of neurological deficit. Symptoms of intracranial hypertension are frequently present. The neurological deficit can appear suddenly in the case of intratumoural bleeding. The most common tumours are brain metastases (Fig. 12.3), gliomas and lymphomas (Fig. 12.4).
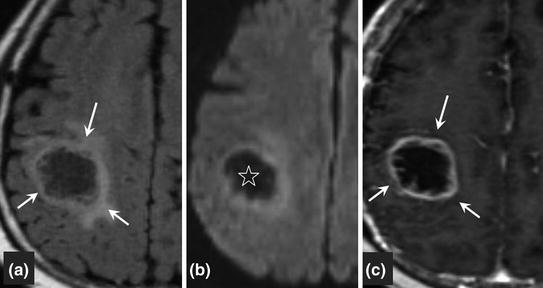
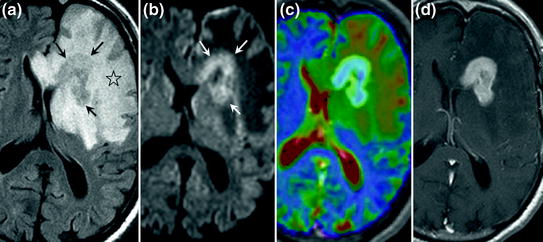
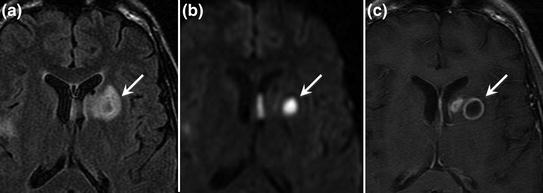
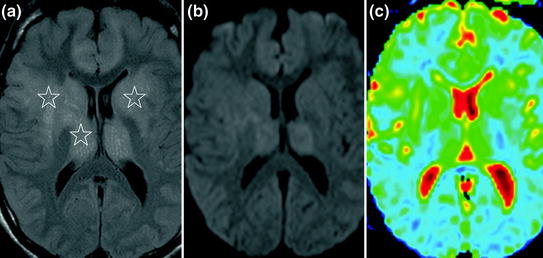
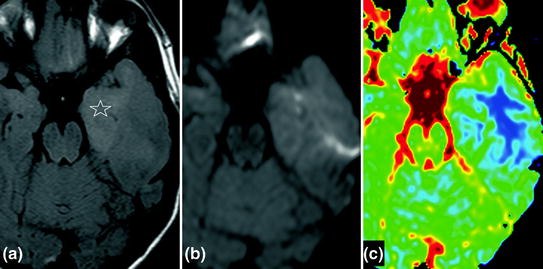
Fig. 12.3
Brain metastasis on MRI. The lesion has a heterogeneous appearance on FLAIR images with a hyperintense margin (a arrows) and a hypointense centre. On diffusion-weighted imaging, the lesion is hypointense (b) associated with an increased ADC. On the gadolinium-enhanced sequence, contrast enhancement of the tumour wall (c arrows) with no enhancement of the necrotic centre
Fig. 12.4
Primary lymphoma of the brain. The lesion is hyperintense on FLAIR images (a arrows), with extensive perilesional oedema (a star), hyperintense on diffusion-weighted images (b arrows) with decreased ADC (c ADC map; the lesion is blue due to decreased ADC). Gadolinium enhancement of the lesion (d)
Fig. 12.5
Pyogenic brain abscess on MRI. The lesion is hyperintense on FLAIR images (a arrow) with a less intense centre. On diffusion-weighted images (b arrow), the lesion is hyperintense (limited diffusion with decreased ADC) Gadolinium enhancement of the abscess wall (c arrow)
Fig. 12.6
MRI of infectious encephalitis in a patient with AIDS, involving the frontal lobes and basal ganglia. On FLAIR images, the lesions are hyperintense (a stars), disseminated and do not correspond to an arterial territory. On diffusion-weighted images, the lesions are isointense (b) due to moderately increased ADC caused by vasogenic oedema (c)
Fig. 12.7
Herpetic encephalitis involving the temporal lobes, predominantly on the left side. On FLAIR images, the lesions are hyperintense (a star), disseminated and do not correspond to an arterial territory. On diffusion-weighted images, the lesions are hyperintense (b) due to moderately decreased ADC caused by cytotoxic oedema (c)
Imaging
Mass effect on adjacent structures. No systematized vascular territory involvement. Contrast enhancement may be observed. Necrotic zones present an increased ADC (hypointense on diffusion-weighted images). Note that tumours can bleed (particularly metastases) and may initially be mistaken for haematoma.
Infections
Abscess (Fig. 12.5)
Clinical setting of sepsis and sometimes immunodepression.
Note that fever is often absent.
Usually rapidly progressive deficit.
Imaging
A marked mass effect on adjacent structures and hyperintense perilesional oedema are generally observed on T2-weighted and FLAIR images. Hyperintensity on diffusion-weighted images (decreased ADC) or normal diffusion. Annular contrast enhancement of the wall. No systematized arterial involvement.
Encephalitis (Figs. 12.6 and 12.7)
Specific features depending on the cause (infectious, metabolic, toxic, etc.).
Rapidly progressive, rather than sudden onset of disorders.
Disorders of consciousness (obtundation, confusion, coma) are almost constantly present.
Seizures are frequently associated.
Imaging
Parenchymal oedema (hyperintensity on FLAIR and T2-weighted images, hypodensity on CT) with moderate mass effect on adjacent structures. Normal or elevated ADC due to vasogenic oedema (iso- or hypointense on diffusion-weighted images), sometimes decreased (hyperintense on diffusion-weighted images). ADC is markedly decreased in the presence of abscess.
Disruption of blood–brain barrier with possible contrast enhancement of parenchyma. On perfusion-weighted images: prolonged MTT due to oedema; CBV is maintained or only moderately decreased
PRES (Posterior Reversible Encephalopathy Syndrome) (Fig. 12.8)
Definition
PRES is a radiological syndrome and not a clinical syndrome. Vasogenic oedema due to disruption of the arteriolar blood–brain barrier. The abnormalities are reversible. Haemorrhage may be associated in 15 % of cases (meningeal haemorrhage, cerebral haemorrhage or microbleeds), independently of blood pressure, depending on the aetiology.
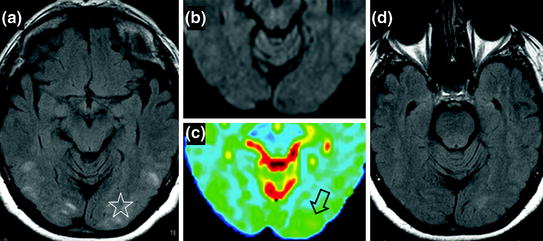
Fig. 12.8


Hypertensive encephalopathy in a patient with headache associated with bilateral blindness in a context of hypertensive crisis. FLAIR sequence at the acute phase shows multiple cortical/subcortical hyperintensities clearly predominant in the occipital regions (a star). Diffusion-weighted images (b) and ADC colour mapping show typical vasogenic cerebral oedema with increased ADC (c hollow arrow) and isointense signal on diffusion-weighted images compared to healthy cerebral parenchyma. The follow-up FLAIR sequence (d) demonstrates the reversible nature of the lesions after correction of blood pressure, with resolution of the initial hyperintensities
Related posts:


Stay updated, free articles. Join our Telegram channel
Full access? Get Clinical Tree
