From this can be calculated for various age groups:
• Up to 15 years of age: QAlb (ref) = 5 × 10⁻³.
• Up to 40 years of age: QAlb (ref) = 6.5 × 10⁻³.
• Up to 60 years of age: QAlb (ref) = 8 × 10⁻³.
Blood–CSF barrier dysfunction. Due to strong individual variations, like body size of the patient, or due to preanalytical influences, like volume of extraction, a blood–CSF barrier dysfunction QAlb > QAlb (ref) should be diagnosed with higher significance (+10% or +20% level) if

as proposed for statistics with an example in Table 5.8.
Albumin quotient in ventricular and cisternal CSF. Corresponding to the rostrocaudal concentration gradient, the CSF concentration of serum proteins increases from the ventricles (V) to the cisterns (C) and lumbar spaces (L); accordingly, the age-related reference ranges for QAlb change as well. The reference ranges for ventricular and cisternal CSF are thus calculated as follows from those valid for lumbar CSF:


Reference Ranges for Immunoglobulins in CSF
The reference ranges of blood-derived immunoglobulin fractions in CSF are used for analytical orientation but not for diagnostic purposes (Table 21.5).
Brain Proteins
Table 21.6 shows the mean concentrations of primarily brain-derived proteins, arranged according to their concentrations in CSF (Thompson, 2005; Zettl et al., 2005).
Amino Acids, Lipids, and Vitamins
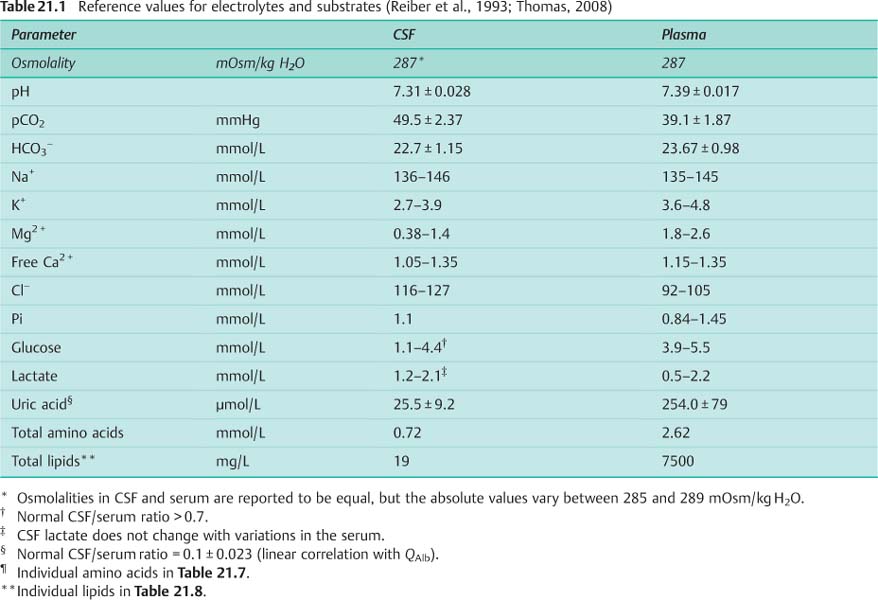
Table 21.7 shows the mean concentrations of free amino acids in CSF and serum and Table 21.8 that of the lipids in CSF. The concentrations of vitamin C and vitamin E in CSF and serum (Table 21.9) are important for the understanding of the reduction-oxidation balance in the brain cells (see also Chap. 6, “Special Serum Analysis”). Vitamin C (ascorbic acid) is actively transported from blood to brain, ten-fold increased in intercellular fluid and CSF, with subsequent active uptake into brain cells. Due to CSF outflow into venous blood, the serum concentration of vitamin C depends on QAlb (Reiber et al., 1993).
Vitamin E is a mixture of 75–87% α-tocopherol, about 10% γ-tocopherol, and others. About 70% of α- and γ-tocopherol are associated with HDL-LDL in the serum. α-Tocopherol and γ-tocopherol pass the blood–CSF barrier in association with a protein larger than 100 kDa. As a consequence, the CSF/serum tocopherol quotient correlates strongly with QAlb: Qα-T = 0.83 × QAlb, Qγ-T = 0.76 × QAlb (Uhr, 1995).
Cells
Cell Counts in CSF
CSF cell counts (see also Chap. 5, “Cytology”) up to 4 cells/μL are normal. Counts above 20 cells/μL are interpreted as showing definite inflammation. The differential cell count is normal when 70–100% lymphocytes and up to 30% monocytes are present. Occasionally, the following cells are also found in normal CSF without having pathognomonic significance:
• Ependymal cells, choroid plexus cells, or cartilage cells.
• Very rarely also a mitotic monocyte.
The following cell types in CSF should always be characterized as abnormal cytological findings:
• Granulocytes.
• Plasma cells.
• Macrophages.
• Erythrocytes (unless artificially introduced by puncture).
• Cells in mitosis, such as tumor cells.
In bacterial meningitis, microorganisms are often directly visible in the CSF (Kölmel, 2005).
Correction of Cell Count and Protein Concentration when Artificial Blood Contamination Has Occurred
Artificial blood contamination of CSF may falsify the CSF data significantly. To some extent, it is possible to correct the data. As shown in Table 21.10, the error of the IgG value in CSF is below 20%, even with a contamination of 2000 erythrocytes/μL. Considering the large range of biological variation, minor artificial contamination with blood (< 1000 erythrocytes/μL) is negligible in respect of protein values.
CSF in which artificial blood contamination exceeds 7000 erythrocytes/μL should not be used for interpretation in the quotient diagram—mathematical correction is no longer reliable.
The reference to the erythrocyte count does not take into account the individual hematocrit, because the underlying cell numbers counted in CSF are generally too low.
Correction of leukocyte counts.
Stay updated, free articles. Join our Telegram channel

Full access? Get Clinical Tree


