Fig. 1
Schematic view of the experimental setup
3 Results of the Transfer Entropy Analysis
Transfer entropy T I→J , a measure of information flow from a stochastic process I to another process J, is defined by
 where x n and y n represent the stochastic sequence of processes I and J, respectively. Here, we analyzed this value based on turn-taking, where the first sender attempts to inform the initial position and the second sender attempts to indicate a destination position that both can reach.

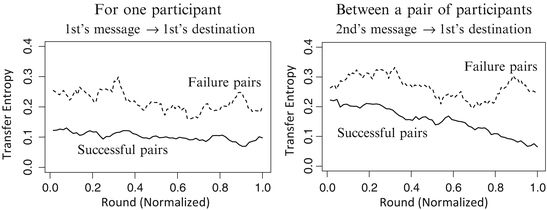
The transitions of transfer entropy are shown in Fig. 2. The left-hand graph depicts transfer entropy for one participant, where I and J represent the sequences of the first sender’s messages and his/her destinations, respectively. This value for successful pairs (solid line in Fig. 2 left) stayed at a low level from the beginning of the experiment, while that for the failure pairs (dashed line in Fig. 2 left) fluctuated in the mid range. By contrast, transfer entropy between a pair of participants (solid line in Fig. 2 right), where I is the sequence of the second sender’s messages and J is that of the first sender’s destinations, began moderately and declined over time for successful pairs, but did not decrease from this average level for the failure pairs (dashed line in Fig. 2 right). Further, transfer entropy for the successful pairs negatively correlated with the performance of the task.


Fig. 2


Transitions of transfer entropy for one participant, from the first sender’s message to the first sender’s destination (left), and between participants, from the second sender’s message to the first sender’s destination (right). The solid lines represent successful pairs and the dashed lines failure pairs. The X-axis is the normalized round, since the number of rounds differ by pair
Stay updated, free articles. Join our Telegram channel

Full access? Get Clinical Tree


