Fig. 1
Process flow of master generation (a–f) and microchannel replica molding from master in PDMS (g–i). The scaffold can either be used directly in neural guidance studies or be functionalized e.g., with conductive polymers (j–l)
2.2 Conductive Materials
If not stated differently, all materials were purchased from Sigma-Aldrich. A composite of carbon, graphite, and poly (3,4-ethylenedioxythiophene):polystyrene sodium sulfonate (PEDOT:PSS) (p Jet 700, Clevios) with up to 5 % of conductivity enhancers was used as a rubber‐like electrode-, conductive track- and connection pad-filling. The carbon/graphite/PEDOT:PSS composite was mixed into pre-mixed PDMS prepolymer and curing agent (Sylgard 184, Dow Corning) in a 1:1:3 ratio until its DC resistivity dropped below 10 kΩ over a distance of 5 mm. The track-, contact pad- and electrode-cavities were filled with the conductive material by spreading it onto the polyMEA scaffold. Excess material was removed by first swiping the surface with the edge of a ruler, then with a cotton swab and filter paper. This procedure removed the shortcuts between pads and tracks. In a final step, the surface of the polyMEA was cleaned by rolling a lint remover over it. To ensure that no shortcuts had remained, adjacent contact pads were probed by an ohmmeter. The conductive composite was cured at 120 °C for one hour. The polyMEAs were then backside-insulated by a second layer of PDMS. The contact pads of in vivo polyMEA probes were slid between the pins of Omnetics connectors. A folded laser transparency between the folded polyMEA helped in pressing the pads against the connector pins, thereby establishing electrical contact. A thin PDMS coat can be used for pad/pin insulation thereafter. Device biocompatibility was tested in cell culture. The electrical characteristics were determined by electrical impedance spectroscopy. PolyMEA recording functionality was validated with cortical cultures after 7 days in vitro (DIV).
2.3 Electrochemical Characterization of polyMEA Electrodes
The electrodes of polyMEAs were characterized by electrochemical impedance spectroscopy (EIS). The polyMEAs were placed in a custom-made Faraday box and their pads sequentially connected by a gold-coated spring-contact probe. The electrodes were immersed in saturated KCl at room temperature. A silver/silver chloride wire (Ø1 mm) was used as a reference electrode and a Pt sheet (2 × 3 mm2) as the counter electrode. Impedance spectroscopy was performed at frequencies between 1 Hz and 100 kHz (Perstat 2273, Princeton Applied Research).
2.4 Cell Culture
If not stated differently, all cell culture chemicals were purchased from Invitrogen. PDMS in vitro polyMEAs and commercial MEAs (Multi Channel Systems), PDMS caps [13] and PDMS microchannel tiles were autoclaved at 120 °C for 20 min before being moved to the sterile hood. To increase their surface hydrophilicity, MEAs and polyMEAs were exposed to oxygen plasma (0.5–2 min, 50 W, 2.45 GHz, 0.3 mbar O2) [femto, Diener]. Their central surface was then coated with 20 μL of 0.1 mg/mL poly-d-lysine (PDL) and 0.05 mg/mL laminin, which was allowed to dry in vacuum. To remove soluble PDL, MEAs were rinsed twice with sterile ultrapure water and dried. After complete water evaporation, the PDMS microchannels were aligned on the surface of the commercial MEAs using a sterile water droplet. The crossing points of the microchannels were placed on the electrodes. Therefore, every microchannel included eight electrodes in one row or column (e.g., 68 to 61 in Fig. 2). Cell suspensions (rat E18) were prepared following standard protocols [2]. For microchannel devices on commercial MEAs, a small drop (5 μL; 10,600 cortical neurons/μL, ∼50,000 cells per device) was placed into just one out of four reservoirs. On polyMEAs, about 100,000 cells were plated onto their central electrode area. Cells were allowed to settle for 30 min in a cell culture incubator (5 % CO2, 37 °C, 95 % RH) before adding 1 mL of serum-free medium (Neurobasal medium, B27 2 %, Glutamax 1 %, penicillin/streptomycin 1 %). Cultures were protected by a PDMS cap against evaporation and contamination [13] and stored in the incubator. Every week, 450 μL of media was exchanged with fresh warm media. Cultures were imaged once a week on an inverted microscope (DMIL, Leica Microsystems) equipped with a 5 MP camera (DFC420C, Leica Microsystems).
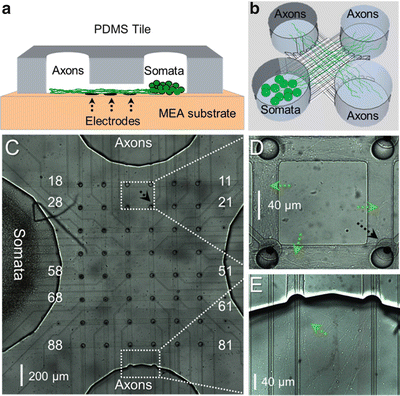

Fig. 2
PDMS microchannel tiles on MEAs for neural network compartmentalization. (a) A schematic cross-section of a microchannel and the reservoirs shows how microchannels selectively let axons grow on top of an electrode row while preventing cell bodies to enter. (b) PDMS microstructure including four big reservoirs interconnected by an 8 × 8 matrix of channels. (c) Cells seeded in a somal compartment (left) had grown their axons after 9 DIV through the entire length of a microchannel into the empty axonal compartment. (d) Magnified view of the axons inside the channels between electrodes 15-14 and 25-24. (e) Magnified view of axons entering the axonal compartment. Black arrows indicate an electrode and green arrows point at axons
2.5 Electrophysiology
Extracellular signals were recorded with a 60-channel filter-amplifier (MEA60-Up, Multi Channel Systems), featuring a built-in thermal sensor and heating element. For microchannel tiles, acquired activity (MC_Rack, Multi Channel Systems) was filtered and analyzed offline. The low frequency noise, which was augmented by the microchannels, was removed by a second-order Bessel high-pass filter (cut-off at 200 Hz). Spikes were detected in the filtered data stream by passing a negative threshold set to –4.5 StDev of the peak-to-peak noise. Only downward threshold-crossings were analyzed.
2.6 Statistical Analysis
Spike trains from microchannel tile recordings were transformed to timestamps (NeuroExplorer, Nex Technologies) for mean frequency and burst analysis. Individual units on each electrode were detected by k-means clustering (Offline Sorter, Plexon). Thereafter, sorted units were checked visually to merge the same units or exclude unsorted rare signals from analysis. Numerical results were further analyzed by a one-way repeated measures analysis of variance (ANOVA) or a two-way ANOVA, followed by a Bonferroni post-test for all groups (Prism, GraphPad). A probability of p < 0.05 was considered significant. Data are expressed as mean ± SEM or as quartiles (Whisker-bars) with maximum and minimum values.
3 Results
3.1 Recording Activity from Microchannel-Confined Axons
Cells started to grow their neurites into the microchannels after 3 DIV. After 9 DIV, axons had almost passed through the entire channel and entered into one of the three axonal compartments (Fig. 2). The neuronal tissue mass inside the channels was increasing up to 27 DIV. Afterward, neural tissue inside the channels and the axonal compartments started to degenerate and thick axonal bundles appeared (Fig. 8c).
Because the microchannels were aligned with the electrodes, axons were forced to grow over the electrodes. The small microchannel cross sections (40 μm × 5 μm) increased the electrical resistance to ground, thereby amplifying the weak extracellular axonal signals. At 9 DIV, first signals could be recorded. They were similar in shape to random networks, but had higher amplitudes (>100 μV; Fig. 3a). The signal amplitudes increased up to 600 μV after 20 DIV (Fig. 3b). The microchannels not only allowed to record from axons, but also forced the same axon to pass over or nearby all electrodes in one row of the electrode array (Fig. 2c; e.g., electrodes 28 to 21). This made it possible to record from the same axon at its different lengths. Therefore, the same signal appeared with short delay on subsequent electrodes as it propagated along the axon (Fig. 3).
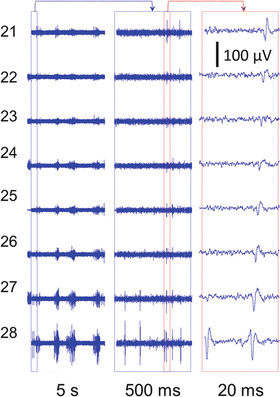

Fig. 3
Sample recording from electrodes in channel 2 at 30 DIV. The right panel shows the magnified propagating signal along the full length of the channel from electrode 28 toward electrode 21 (see Fig. 2c)
Compared to the diameter of an axon (1 μm), the width of a microchannel was sufficiently large (40 μm) to let different axonal branches from the same network enter into it. Therefore, every electrode inside the microchannel could simultaneously record from different axons. Signals were sorted by shape to distinguish between the different axons (sources) (Fig. 4a–c). In general, two main signal categories were detected inside the microchannels; monophasic signals (mainly with negative wave) and biphasic signals (mainly with a negative followed by a positive wave). In contrast to quickly decaying biphasic signals, monophasic signals could propagate to distant electrodes inside a microchannel. This feature was amplitude-independent (Fig. 4b). Overlaying the signals recorded from subsequent electrodes inside the same channel showed the propagation delay and how the signal shape varied with location (Fig. 4c).
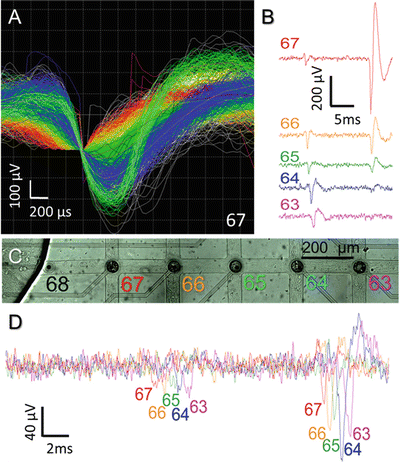

Fig. 4
Signals with different amplitudes and shapes were propagating in channels. (a) Signal sorting for electrode 67 shows five different waveforms that were recorded by this electrode. (b) Shape and propagation length of monophasic and biphasic signals in channel 6 from electrode 67 to 63. (c, d) Overlaid signals recorded from electrodes 67 to 63 show the propagation delays for a signal traveling within an axon over sequential electrodes
To analyze the network activity evolution and the propagation velocity along the axons inside the microchannels over time, the electrical activity at 10, 20, 30 and 53 DIV was compared. To evaluate how activity levels change over time or along channels, two subsequent electrodes in a channel were considered as one segment, thereby dividing every channel into the following four segments: Seg 1 (0–250 μm), Seg 2 (250–650 μm), Seg 3 (650–1,050 μm) and Seg 4 (1,050–1,300 μm) (Fig. 5a). Because the amplifiers for electrodes 27, 52 and 62 were switched off at 10 and 20 DIV, data for the respective segments was collected on these two days from one electrode only. A comparison of the overall number of spikes per minute in the proximal segments of all considered channels with that of their distal segments showed that the signal frequency decreases along the channel for all recording days (p < 0.001 at 10 and 30 DIV, p < 0.01 at 20 DIV; Fig. 5b). Monitoring the mean signal frequency in each segment over time (Fig. 4c) showed a significant decrease at 53 DIV compared to 10 DIV in segments 1, 2 and 3 (p < 0.05).
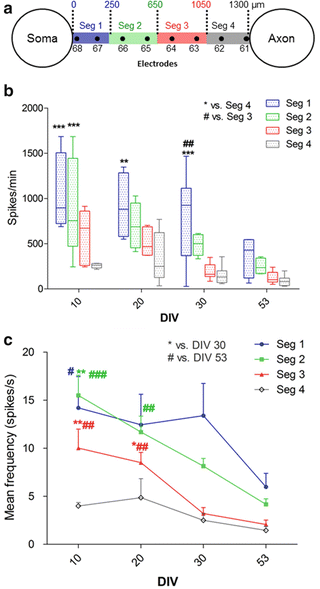

Fig. 5
The spike frequency decreased along a channel and over time. (a) Each microchannel was divided into four sections for a spike frequency analysis in the following way: segment 1 (Seg 1 = 250 μm from channel entrance), Seg 2 (250–650 μm), Seg 3 (650–1,050 μm), Seg 4 (1,050–1,300 μm). Each segment represents data that was collected from two adjacent electrodes. (b) Spike frequency along the channel. Each bar represents the spike frequency range in one segment (color) on the mentioned day. The mean spike frequency was calculated by averaging the number of spikes per minute in a selected segment of channels 2, 5 and 6. A two-way ANOVA was applied for comparing the mean values between different segments on the mentioned day. * vs. Seg 4 and # vs. Seg 3 at the same DIV. (c) Spike frequency evolution over time. Each line represents the changes in the mean spike frequency of the same segment (averaged over three channels) at different days. A one-way repeated measures ANOVA was applied for analyzing the mean frequency between different DIVs in each segment. * vs. DIV 30 and # vs. DIV 53 of the same segment. * or #p < 0.05, ** or ##p < 0.01 and *** or ###p < 0.001
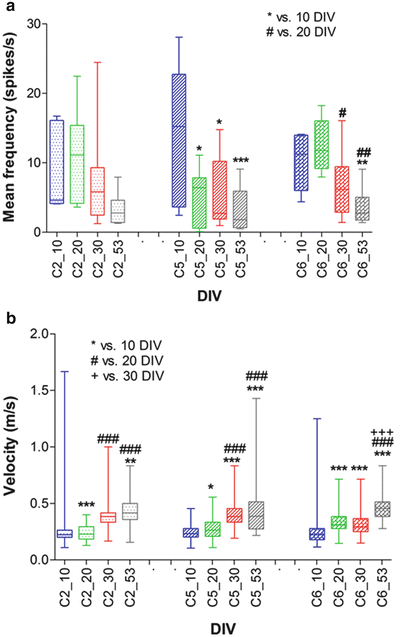
Signal frequencies and propagation velocities were evaluated in detail for three selected channels (channel 2 (electrodes 21–28), 5 (electrodes 51–58) and 6 (electrodes 61–68)). The mean signal frequency for each channel was calculated by averaging all recorded signals from any of the electrodes inside a single channel. The mean signal frequency for each channel tended to decrease over time. This decrease was significant between 10 DIV and the subsequent DIVs for channel 5 (p < 0.05 vs. 20 and 30 DIV, and p < 0.001 vs. 53 DIV; Fig. 6a) and channel 6 (p < 0.05 vs. 30 DIV and p < 0.01 vs. 53 DIV; Fig. 5a). The propagation velocity was calculated by dividing the constant distance between a pair of electrodes (200 μm) by the temporal delay of the signal appearance on two subsequent electrodes. The mean propagation velocity for each channel was calculated by averaging the propagation velocities of all subsequent electrode pairs in a channel. For electrodes from which no signals were acquired in 10 and 20 DIV (electrodes 27, 52 and 62), the average velocity was calculated for the two nearest electrodes (channel 2; electrodes 28 and 26, and channel 6; electrodes 63 and 61). The mean propagation velocity tended to increase with culture age, which was contrary to the observed decrease in the spike frequency (Fig. 6a, b). Propagation velocity clearly increased with respect to 10 DIV in channel 2 (p < 0.001 vs. 20 DIV and p < 0.01 vs. 53 DIV; Fig. 6b), channel 5 (p < 0.05, p < 0.001 and p < 0.001 vs. 20, 30 and 53 DIV, respectively; Fig. 6b) and channel 6 (p < 0.001 vs. 20, 30 and 53 DIV; Fig. 6b). This increase was also significant when compared between 20 DIV and the subsequent recording days at 30 and 53 DIV in all channels (p < 0.001; Fig. 6b).

