Fig. 3.1
Sleep macro- and microstructure. (a) Sleep time (S) is controlled by both circadian and homeostatic factors, the latter building up as waking (W) progresses and diminishing slowly after sleep onset. (b) On the basis of EEG, EOG and EMG features a whole night’s sleep is described by a hypnogram (blue) denoting about 6 cycles of about 90 min duration, each containing a NREM and a REM part. NREM includes four stages (N1–N4). Elements of sleep microstructure are shown as K-complexes (KC, green dots), microarousals (MA) or rare awakenings (AW). (c) Time frequency analysis (hypnospectrogram color coding EEG power) for the same sleep reveals the frequent presence of spindles (S, 12–15 Hz) mainly during stage 2 of NREM sleep

Fig. 3.2
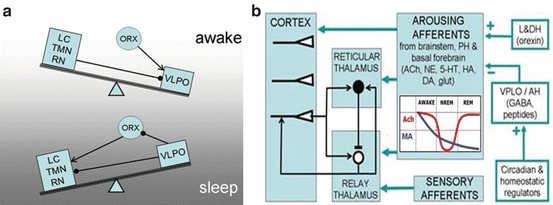
Mechanisms promoting sleep. (a) According to a seesaw model sleep starts when hypothalamic centers like nucleus posterolateralis (VLPO) inactivate those centers of brainstem which maintain wakefulness like locus coeruleus (LC, releasing norepinephrine), tuberomamillary n. (TMN, releasing histamine), raphe n. (RN, releasing serotonin) and others. Additionally VLPO inactivates orexinergic (ORX) neurons which also promote arousal. Arrows and filled circles denote respectively excitatory and inhibitory connections. (b) Simplified diagram of brain circuits involved in sleep onset. AH and L&DH indicate respectively anterior, lateral and dorsal hypothalamus. Ach: acetylcholine, NE: norepinephrine, 5-HT: serotonin, HA: histamine, DA: dopamine, glut: glutamate. While all monoamines (MA, blue curve) decrease throughout sleep, Acetylcholine (red curve) is the only neuromodulator supporting REM sleep. The induced by hypothalamus diminution of ascending inputs to thalamus and cortex promotes oscillatory activity in the frequency of spindles or delta waves which blocks sensory processing from reaching the cortex
Additionally, ‘external’ influences (i.e. circadian rhythms and sensory stimuli on the Reticular Activating System—RAS) can ‘switch’ between sleep and wakefulness.
Wakefulness is maintained through the tonic activity in the RAS from the upper brain stem and the thalamocortical and cortical projections from the posterior hypothalamus and the basal forebrain. The transition to sleep is caused by both a withdrawal of external stimuli from the RAS and an activation of the hypothalamus’ preoptic area [23]. This leads to a widespread increase in GABAergic activity that gives rise to the relative synchronous oscillations of NREM sleep such as sleep spindles, delta activity and the slow cortical oscillations.
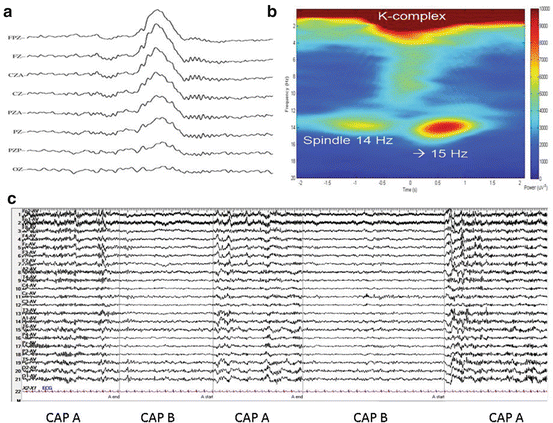
At the microstructure level of NREM sleep organization, the cyclic alternating pattern (CAP) alternates with periods of quiescence (non-CAP periods) (Fig. 3.4c); NREM sleep is thus divided into periods showing CAP and periods not showing CAP. During the CAP periods, phases containing arousal phenomena and therefore indicate increased vigilance (phase A of CAP) alternate with phases without arousal phenomena, which correspond to reduced vigilance (phase B of CAP) [24].
Sleep spindles (Figs. 3.1c and 3.4a) generated by the reticular nucleus of the thalamus (RE) and its connections to the dorsal thalamus (Fig. 3.2b), consist of a 10–14 Hz activity lasting 2–3 s occurring especially in stages 2 and 3 of NREM sleep. The spindle oscillation is transferred to the thalamocortical relay cells, traveling to the cortex, generating rhythmic excitatory postsynaptic potentials and a synchronous activity over widespread cortical regions that can be observed at the macroscopic/EEG level [25]. Inhibitory RE to RE neurons collaterals desynchronize spindle activity limiting both the amplitude and the duration of sleep spindles [26].
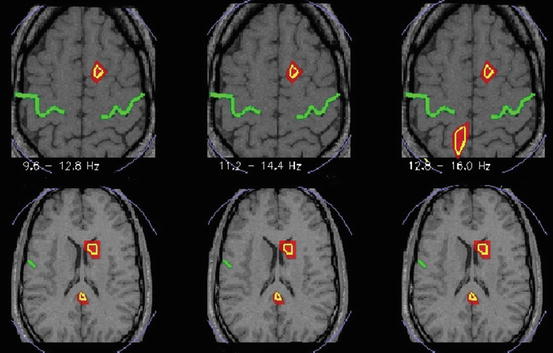
Modeling of spindles from the EEG and MEG signal was remarkably unsuccessful in illuminating the nature of the generators that appeared to be dispersed in different areas with little consistent regularity within and across events. This was rather surprising given the rather widespread and consistent spindle imprint on the EEG (in terms of signal morphology of the sigma-band-pass filtered signal of central and dorsal EEG sensors. One plausible explanation was that the problem arose because the source localization algorithms did not have sufficient power to disentangle activity from a mixture of superficial and deep generators. In recent years a series of studies focused on the problem of identifying the generators of spindles from EEG, MEG, simultaneous EEG and MEG [27, 28], EEG triggered fMRI and invasive measurements in humans [29, 30] begin to converge to a rather surprising but consistent picture: spindles are sporadic events that at least in the cortex occur asynchronously over wide areas and with high variability from event to event. Our own tomographic analysis confirms the high variability of generator loci from spindle to spindle but provides a unified picture of the evolution of activity from the awake state through core periods of light sleep and the periods before and during spindles and K-complexes (Ioannides et al., in preparation). All of the established features of spindles are recovered by the tomographic analysis, but they appear strongly when the appropriate comparison is made between conditions. An example is demonstrated in Fig. 3.3: comparing the spectral density of individual events during and just before spindles shows the anterior foci of the low sigma activity and the more posterior foci in the high sigma periods. In addition and in a more ventral level increases during the spindles are seen for the entire sigma band in posterior cingulate and in the right caudate [31].


Fig. 3.3
Spectral statistics of MEG tomographic data showing statistical significant changes of activity common to all four subjects in three narrow frequency bands, alpha and low sigma band (9.6–12.8 Hz) statistical parametric, main sigma band (11.2–14.4 Hz) and high sigma band (12.8–16 Hz). Yellow outline marks common for all 4 subjects statistics at p < 0.05. The green line indicates the central sulcus. The left hemisphere is on the left. The MRIs at the more dorsal/upper (15) and more ventral/lower (11) level are slightly off scale to fit the space provided
Spindles appear to play at least three roles. (a) shaping the early organization of sensory-motor cortical circuits [32] (b) maintaining sleep by increasing the threshold perceiving sensory stimuli [33] and (c) helping memory consolidation through a cortico-hippocampal interaction [34].
The delta oscillation (1–4 Hz) has both a thalamic [35] and a cortical component [36] and seems to result from the same circuit that generates sleep spindles. However, spindle and delta activity exclude each other within the thalamocortical neuron, with spindle activity arising at relatively depolarized resting membrane potentials and delta activity arising at more hyperpolarized membrane potentials [37].
Slow cortical oscillations at frequencies bellow 1 Hz, observed during slow wave sleep, are generated in the cerebral cortex with different cortical areas synchronizing in a widespread manner through corticocortical connections. K complexes (Fig. 3.1b), a fluctuating arousal occurring at periodic intervals during NREM sleep, can be triggered by both external sensory stimuli as well as internal very slow sleep oscillations [38]. They appear to have a very dynamic relationship to spindles and to theta bursts (Fig. 3.4a, b) [39, 40].


Fig. 3.4
Elements of sleep microstructure putatively involved in seizure expression. (a) K-complex followed by spindles in central EEG electrodes FPZ to OZ. (b) Averaged spectrogram of many K-complexes. Note the interruption of preceding spindle, development of a theta burst and the increased frequency of the spindles following the K-complex. (c) Cycle alternating patter in EEG during NREM with most power concentrating in periods “A”
K complexes, sleep spindles and arousals but also epileptiform discharges and seizures (more about this later) seem to occur during the A phase of CAP and seem to be inhibited during the B phase of CAP (Fig. 3.4c) [41].
During REM, the selective reactivation of the RAS cholinergic system with neurons releasing serotonin or norepinephrine on the thalamocortical system remaining inactive, leads to the observed EEG activity which is similar to what it is observed during wakefulness but with muscle atonia. Lastly, the transition to waking, is caused by the activation of the cholinergic as well as monoaminergic nuclei in the brainstem (Fig. 3.2b) and a resultant activation of the thalamocortical cells [42].
Thanks to the tomographic analysis of MEG data the changes during sleep can be studied non-invasively using MEG. The first tomographic analysis of whole night MEG data revealed the complexity of the processes involved [43] but also provided hints of a global organization and a relatively smooth transition from one stage to the next when the quiet rather than active periods of each sleep stage were compared [44]. The most consistent change running through all sleep staged was identified in near-midline areas on the left hemisphere, one in the frontal lobe and the other in the posterior mid-parietal area. In these two areas the gamma band activity was higher during REM sleep than other sleep stages and active wakefulness. A meta-analysis of recent neuroimaging studies showed that these two areas are at the centre of foci of increased activity identified in experiments with increased resting state activity compared to task periods (areas belonging to the “default system”) and areas identified in experiments requiring understanding own and other peoples intention and introspection (areas of the “Theory of Mind” system). It seems significant that the areas identified in the earlier sleep study, the default mode areas and the Theory of mind area were not just randomly placed with respect to each other. The areas of increased gamma band activity were at the centre and not overlapping with the areas of the two other systems, suggesting they play a pivotal role in maintaining the person’s identity through sleep. This makes us dare pushing beyond the suggestion of Domhoff that the default network might be involved in dreaming [45, 46]; we could suggest that the areas identified as super-active in the gamma band during sleep, and especially the dorsal medial prefrontal cortex are acting like a “Dream Box” releasing consciousness while the rest of the brain is largely subdue. Our recent research, focusing on light sleep suggests that an area close to the “Dream Box” areas is also important for spindles (Ioannides et al., in preparation).
3.3 The Interictal State and Sleep
Abnormal electrical discharges occurring in the time between seizures are referred to as ‘interictal spikes’. The summation of this abnormal electrical activity along with the signs and symptoms, within a broad psychiatric and behavioral range, is referred to as the ‘Interictal State’ [47].
Interictal spikes consist of abnormal discharges of an inappropriately synchronized population of neurons from focal brain areas. Unlike seizures, interictal discharges do not spread across large brain areas and they do not cause clinical symptoms [48].
Generalized spike-wave discharges in idiopathic generalized epilepsy aggravate as NREM sleep progresses and after awakening, while they diminish during REM sleep. These discharges tend to occur during CAP-A phases of NREM sleep. A study on patients with JME showed that their distribution in CAP phases (A or B) may relate to (or even predict) seizure control. Increased epileptic pressure may cause disruption of the inhibitory mechanisms of phase B, increase the CAP rate by contributing to more A phases, and thereby foster more epileptiform discharges through the CAP A window. In other words there seems to be an epileptic positive feedback with clinical correlates: increased seizure activity is associated with enhanced intrusion of spike wave activity into phase B of CAP sleep, increased CAP rate, more epileptiform discharges and by implication higher probability of having more seizures. Increased electrographic awakenings fragment sleep and may independently contribute to the clinical deterioration by impairing sleep quality [49]. Similar findings were noted in childhood absence epilepsy [50]. Also, generalized spike–wave discharges alter morphologically during NREM sleep [51, 52].
Also, in partial epilepsies NREM activates interictal discharges while REM suppresses them without being clear though, which stages of NREM aggravate discharges; some studies suggest that interictal discharges increase during NREM stages 1–3 [53] and others suggest that they increase during NREM stages 3–4 instead [54].
Besides NREM’s effect on the rate that interictal discharges occur, discharges seem to also be more widespread in terms of their partial extent during NREM than during wakefulness or REM sleep. Yet, it has been debated that interictal discharges observed during NREM are of a lower value to localizing the true epileptic focus in contrast to activity observed during REM and wakefulness [54], since there is a large percentage of novel epileptiform foci, unrelated to the true epileptic focus, observed during NREM even from the contralateral hemisphere.
Lastly, ripples (80–250 Hz) and fast ripples (>200–250 Hz), which seem to be generated within the neocortex or the hippocampus, and have been correlated to the interictal to ictal transition [55] also seem to be enhanced by NREM sleep [56]. Schevon et al. [57] suggested that fast ripples are produced by cortical domains near locally excitable clusters that produce microdischarges and are better correlated to interictal epileptiform events. High frequency oscillations, the increasingly recognized biomarkers of the epileptogenic zone [58, 59] are facilitated by slow waves in NREM sleep [60].
All mentioned above, indicate the relation of epileptiform activity to the increased neural synchronization that is observed during NREM sleep as it is to be discussed below.
3.4 Epileptic Seizures and Sleep
Similarly to interictal discharges, seizure activity is also correlated to sleep and it is modified both by the sleep wake cycle as well as the sleep stage. Early observations since the nineteenth century have tried to classify epilepsies into diurnal vs. nocturnal or diffuse [61] and Janz at 1962 [62] described the awakening epilepsies, which occur upon or soon after awaking and seem to be primary generalized in nature.
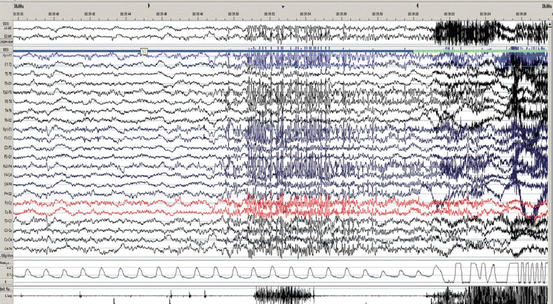
Idiopathic generalized epilepsies (IGE) include awakening epilepsies while only a minority of them may present with EEG abnormalities seen only during sleep; even then, seizures (absences, myoclonic and tonic-clonic) occur during wakefulness. Idiopathic focal epilepsies can occur during sleep in as much as 80 % of cases [63]. Frontal lobe seizures typically occur during NREM sleep, particularly during stage 2 (N2) (Fig. 3.5—nocturnal seizure with genital automatisms) while temporal lobe seizures are more likely to generalize during sleep [64]. In NFLE the vast majority of seizures will occur during sleep with NREM sleep enhancing focal epileptiform activity in association to the A phase of CAP A [65].


Fig. 3.5
Nocturnal frontal lobe seizure, seemingly arising from N3. The actual seizure discharge starts at the blue arrow, but sleep stage has already changed from N3 to lighter 3 s before (green arrow) as evidenced by the diffuse increase of faster rhythms. The patient engages in bilateral genital automatisms of which he has no recollection
Epilepsy with continuous spike wave during slow wave sleep (CSWS) and Landau–Kleffner syndrome, are also strictly correlated to the sleep wake state, both showing a continuous spike wave activity during sleep [66].
Sleep stage is a key factor in seizure occurrence and characteristics. NREM sleep facilitates seizure onset and seizure spread whereas REM suppresses them [14]. Slow wave sleep is the state of maximum synchronicity in the brain while K complexes and sleep transients that are often correlated to epileptiform activity during lighter stages of sleep, are related to patterns of periodic arousal instability as it is described by the CAP [65], both indicating the relation to the hypersynchronization and hyperexcitability which characterize epileptiform activity.
Finally, sleep deprivation has been correlated to seizure inducing and precipitating epileptiform discharges possibly by inducing NREM sleep but also through affecting cortical excitability [14].
3.5 Mechanisms Underlying the Effect of Sleep on Epilepsy
3.5.1 Sleep Mechanisms Altering Brain Synchrony and Excitability
The theoretical background of the mechanisms involved in the interaction of sleep and epilepsy include the existence of shared neuronal circuits between sleep and epilepsy, the increased synchronization that is evident during certain sleep stages and seems to facilitate epileptiform activity, and various intrinsic characteristics of the epileptic focus which are influenced by sleep related activity.
Epileptiform activity is generally characterized by hypersynchronization and hyperexcitability. During sleep and wakefulness the level of neural synchronization varies. During NREM sleep there is increased neural synchronization compared to REM sleep or wakefulness. This suggests that different levels of neural synchronization can interfere with the abnormal synchronization occurring during ictal and interictal discharges, promoting it during NREM or suppressing it during REM or wakefulness [14].
Yet neural synchronization during NREM varies [67] and frequencies observed in the delta, theta and sigma band fluctuate during the course of sleep. There are conflicting data on what aspects of the neural activity during NREM promotes epileptiform discharges. The depth of sleep and the log delta power [68], the progression through deeper stages of NREM sleep or lighter stages of NREM sleep [69] and changes in the power in the sigma or theta band [53, 70–73], all have been correlated with the rate of discharges but fail to clearly predict which of the activity seen during NREM promotes discharges. A possible explanation of these varied data lies in the need of a necessary concurrence of neuronal activity of the epileptic loci with the activity of the rest of the brain temporally and spatially. Sigma band is best observed in the frontocentral regions; therefore it is expected to predict discharges coming from these areas [14]. Similarly the epileptic loci may carry some intrinsic rhythmicity itself which could fall within several frequencies normally occurring in the brain. Therefore, a similar extrinsic frequency of the brain would boost and be related to the intrinsic frequency of the epileptic loci. If the intrinsic frequency falls within sigma band for example, it is expected to be better correlated to power in the sigma band or sleep spindles [74].
Α recent study showed that during NREM sleep epileptic spike discharges and high frequency oscillations appeared not continuously but with highest rate in association to larger slow waves and particularly during the highly synchronized transition from “down” to “up” states underlying these waves; not during the “up” states, which is the case with physiological activity [60]. The authors concluded that the activation of epileptic discharges during NREM sleep is not a state-dependent phenomenon but is predominantly associated with specific events, and apparently facilitated by increased synchronization rather than by increased excitability. Understanding the prime cause however remains as challenge, because dynamic bistability of neuronal membrane potentials widespread synchronization are mutually dependent and reinforced (see [3]).
On another note, intrinsic features of the epileptic focus may be responsible for the varied behavior regarding the enhancement or otherwise a relative immunity to the extrinsic synchronized rhythm which is present during NREM sleep [74]. There is data in literature where epileptic foci can be selectively enhanced by NREM in contrast to the rest of the brain or, in other cases, epileptic foci may lose the ability to be modulated by sleep related activity. This could explain the persistence of local hyperexcitability and hypersynchronization of a local area even in the absence of similar extrinsic activity. Yet, for the epileptiform activity to be spread to other regions, as seen to the intractable symptomatic and secondary generalized epilepsies, the synchronized activity that is present during NREM can facilitate the transmission of the epileptiform activity to the proximate normal cortex [74].
Stay updated, free articles. Join our Telegram channel

Full access? Get Clinical Tree


