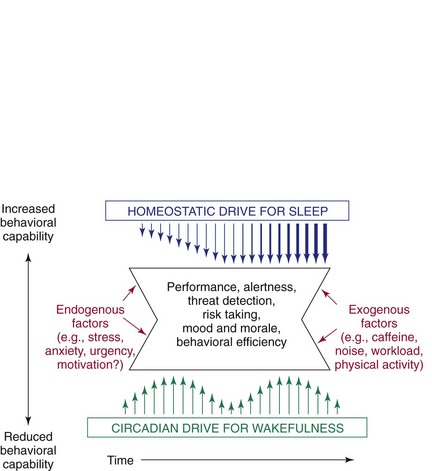
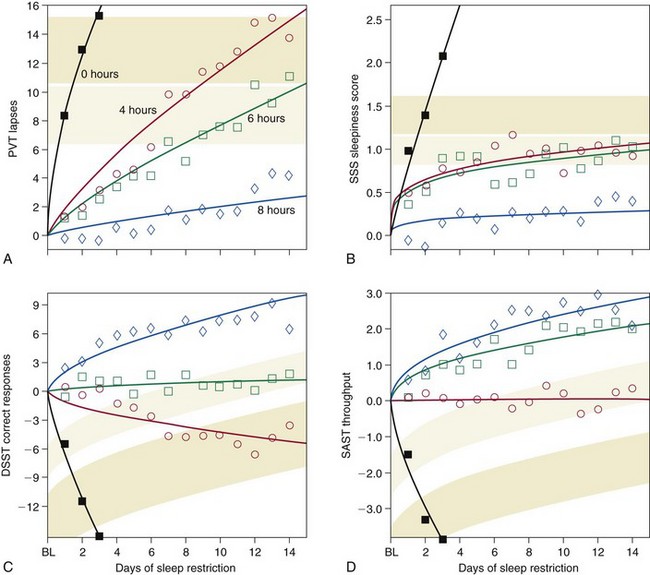
Chapter 5 Excessive daytime sleepiness can result from various sleep pathologies, including sleep-disordered breathing, insomnia, and narcolepsy. Daytime sleepiness can also be due to chronic insufficient sleep associated with lifestyle factors. Nearly 30% of adults in the United States self-report sleeping 6 hours or less per night on average. Time-use surveys indicate that the primary predictor of sleep duration is paid work time and travel time; however, leisure activities and a person’s chronotype (being an “early bird” or a “night owl”) also influence time spent sleeping (Fig. 5-1). When sleep time is limited by social or work obligations, a subsequent increase is found in the frequency of sleep episodes, duration of sleep, and the intensity of sleep. In addition to the circadian rhythm, this homeostatic drive influences the propensity for sleep (Fig. 5-2). As sleep debt is accrued through chronic sleep restriction, feelings of sleepiness increase (Fig. 5-3, B), the latency to fall asleep decreases (Fig. 5-4, C), and individuals experience “microsleeps” when attempting to stay alert. This leads to instability of attention, decreased alertness, impaired working memory, and slowed reaction speed; these deficits persist even after a night of recovery sleep (see Fig. 5.4). Lapses in attention and reduced reaction times caused by sleepiness can lead to errors in the workplace and car accidents (Fig. 5-5). Figure 5-1 A, Work time and travel time are the primary activities that are reciprocally related to sleep time among Americans. The average sleep time for adults who worked 8 hours or more each day was 7 hours and 32 minutes per day; those who worked fewer than 8 hours per day slept 8 hours and 7 minutes per day, and those who did not work slept 8 hours and 50 minutes per day. B, Distribution of wake time. C, Distribution of bedtime. Adults who worked 8 hours or more awoke an average of 0.68 hours earlier than those who worked fewer than 8 hours (P < .0001) and 1.31 hours earlier than individuals who were not working. However, no significant differences in bedtime were found between groups. Watching television is the primary activity people engage in before going to bed, which suggests that adults may be able to extend sleep duration by reducing television viewing and going to bed at an earlier time. (Modified from Basner M, Fomberstein KM, Razavi FM, et al: American time use survey: sleep time and its relationship to waking activities. Sleep 2007;30[9]:1085–1095; and Basner M, Dinges DF: Dubious bargain: trading sleep for Leno and Letterman. Sleep 2009;32[6]:747–752.) Figure 5-2 Schematic representation of the oppositional interplay of circadian and homeostatic drives in the regulation of alertness, performance, and related neurobehavioral functions. Figure 5-3 Four different neurobehavioral assays serve to measure cognitive performance capability and subjective sleepiness.
Sleep Restriction
Sleep Restriction


The homeostatic drive for sleep accumulates throughout wakefulness and progressively downregulates neurobehavioral performance and alertness while increasing subjective sleepiness. Unlike the circadian system, which is limited by its amplitude, the homeostatic drive for sleep can accumulate far beyond the levels typically encountered in a 24-hour day (illustrated by the increasing density of downward arrows). In opposition to these influences on performance and alertness is the endogenous circadian rhythmicity of the biologic clock. Through its promotion of wakefulness, the circadian system modulates the enhancement of performance and alertness. The improvement in waking neurobehavioral functions by the circadian drive is an oscillatory output that periodically involves robust opposition to the homeostatic drive, alternated with periods of withdrawal of the circadian drive for wakefulness. Critical modulators of neurobehavioral functions other than the sleep and circadian drives are subsumed in the schematic under the broad categories of endogenous and exogenous stimulation. These factors can include endogenous (e.g., anxiety) or exogenous (e.g., environmental light) wake-promoting processes that oppose the homeostatic drive for sleep. Alternatively, they can include endogenous (e.g., narcolepsy) or exogenous (e.g., rhythmic motion) sleep-promoting processes that oppose the circadian drive for wakefulness either directly or indirectly by exposing the sleep drive. The neurobiologic underpinnings of these exogenous and endogenous processes are undoubtedly diverse, and few of their interactions with the circadian and homeostatic systems have been studied systematically. (Modified from Goel N, Van Dongen HP, Dinges DF: Circadian rhythms in sleepiness, alertness and performance. In Kryger MH, Roth T, Dement WC: Principles and practice of sleep medicine, ed 5, Philadelphia, 2011, Elsevier.)

Each panel displays group averages of performance for subjects in the 8-hour (blue), 6-hour (green), and 4-hour (red) chronic sleep period conditions across 14 days and in the 0-hour (black) sleep condition across 3 days. Subjects were tested every 2 hours each day; data points represent the daily average (07:30 to 23:30) expressed relative to baseline (BL). A shows psychomotor vigilance test (PVT) performance lapses; B shows Stanford Sleepiness Scale (SSS) self-ratings; C shows digit symbol substitution task (DSST) correct responses; and D shows serial addition/subtraction task (SAST) correct responses per minute. Upward curve movement corresponds to worse performance on the PVT, greater sleepiness on the SSS, and better performance on the DSST and SAST. The curves through the data points represent statistical nonlinear, model-based, best-fitting profiles of the response to sleep deprivation for subjects in each of the four experimental conditions. The mean (± standard error) ranges of neurobehavioral functions for 1 and 2 days of 0 hours of sleep (total sleep deprivation) are shown as light and dark shaded bands, respectively, allowing comparison of the 3-day total sleep deprivation condition and the 14-day chronic sleep restriction conditions. For the DSST and SAST, these bands are curved parallel to the practice effect displayed by the subjects in the 8-hour sleep period condition to compensate for different amounts of practice on these tasks. (From Van Dongen HP, Maislin G, Mullington JM, Dinges DF: The cumulative cost of additional wakefulness: dose-response effects on neurobehavioral functions and sleep physiology from chronic sleep restriction and total sleep deprivation. Sleep 2003; 26[2]:117–126.)![]()
Stay updated, free articles. Join our Telegram channel

Full access? Get Clinical Tree


