Chapter 22 Social class and health
In clinical practice, we are particularly concerned with the health of individual patients. When clerking a patient we ask about occupation with an expectation that what we are told – bus driver, publican, lawyer, computer programmer, cleaner – will tell us something about the risks associated with work. We may also make an instant appraisal of the patient’s lifestyle and material circumstances. Whilst there are significant differences between individual bus drivers and individual lawyers, there is also strong evidence that people’s health is closely associated with their occupation (see pp. 56–57), their occupational group and their social class.
Social class and health
Over the last 100 years there have been great improvements in the health of the UK population (see pp. 40–41). However, inequalities between different sections of the population still exist; one form of increasing disparity that has received particular attention is social class inequality in health (Davey Smith et al., 2000). Death rates for the UK can be calculated for occupational classes by combining data collected on birth and death certificates with occupational data collected at the decennial census. Although reproductive and adult mortality rates for each social class have been decreasing over the last 100 years, there has, however, been an increase in the disparity in mortality rates between social classes I and II, and social classes III to V.
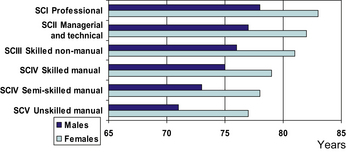
Figure 1 illustrates the most recently reported gradations in life expectancy at birth (see pp. 42–43) from social class I through to social class V (RG classification). Class differentials exist in each of the 14 major cause-of-death categories used in the International Classification of Diseases. When married women are classified according to their husband’s occupation, similar if smaller differentials also appear. Only one cause of death for men, malignant melanoma, and four for women, including breast cancer, show a reverse trend. In general, the evidence also shows that disparities in illness, and especially chronic illness, are at least as wide as disparities in death.

Fig. 1 Life expectancy at birth: by social class and sex, 1997–1999, England and Wales
(from Coulthard et al., 2004, with permission).
Explanations for these relationships – the four hypotheses
Cultural/behavioural explanations
These explanations stress individual or lifestyle differences, rooted in personal characteristics and levels of education, which influence behaviour and are therefore open to alteration through health education inputs leading to changes in personal behaviour. Cultural and behavioural explanations suggest that lack of knowledge and lack of long-term goals give fewer possibilities of making maximum use of health and other services, and of taking preventive health measures (see pp. 64–65). Their main focus has been on the health-related behaviours of cigarette smoking, diet (including alcohol consumption) and lack of exercise:
Stay updated, free articles. Join our Telegram channel

Full access? Get Clinical Tree


