Fig. 5.1
A typical K-complex (KC) examined in the current study. On the left side a data epoch (4 s long) containing a clear KC is shown. The ‘butterfly’ plot of 151 MEG signals (black) is shown together with the EEG signal from C3 electrode (red). The ordinate axes on the left and right sides of the plot show the EEG and MEG signal magnitudes respectively. On the right side of the figure, a topographic map of the MEG signal distribution over the head at the time of the EEG (C3) main negative peak is shown
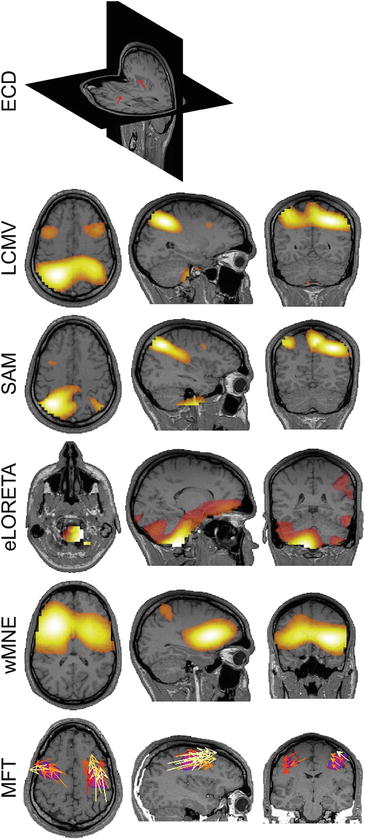
All methods except MFT provided very variable localization across different KCs, all of which were inconsistent with the intracranial findings [1, 8]: “widespread synchronous superficial cortical activity arising maximally within the superior medial and lateral frontal cortices.” In many cases, the KCs were localized in deep medial brain structures as reported also by Wennberg and Cheyne [1]. Conversely, the strongest activations identified by MFT were consistently present during main negative wave of nearly all studied KCs. Moreover, the estimates provided by MFT were most consistent with the intracranial findings [1, 8]; strong and widespread activations were reliably found in superior aspects of bilateral frontal cortex. Figure 5.2 shows ‘best’ result obtained for each method that was most consistent with the intracranial findings [1, 8].


Fig. 5.2
Source localizations from the MEG data at the time of the EEG main negative peak. The ‘best’ localizations, i.e. closest to the intracranial findings [8], among the studied KCs, provided by different methods are shown. From top to bottom the results obtained from ECD model (2 ECDs, 50 MEG sensors), LCMV, SAM, eLORETA, wMNE and MFT are shown. For all methods, except ECD, the strongest activations are shown on coronal (left), sagittal (middle) and axial (right) MRI slices. For LCMV, SAM, eLORETA and wMNE the modulus of the estimated moment is plotted. For MFT the current density vector (yellow and orange arrows) and its modulus (pink blobs) are plotted. In all cases only the values above 50 % of the instantaneous maximum are shown
The MFT results are consistent the results of Wennberg and Cheyne [1] in that the most common source analysis methods used nowadays incorrectly estimate the neural sources of KCs. However, we strongly disagree with their more generalized conclusion that “existing noninvasive source localization techniques may not provide valid solutions for large extended cortical sources such as the human K-complex.” The results of our current study and numerous earlier studies [42–53, 79, 80, 91] show that MFT, a noninvasive source localization technique, provides physiologically valid and accurate estimates for extended as well as focal brain sources.
The ECD model by its nature (one or few point-like generators) is not suitable for the localization of large extended sources, while LORETA, sLORETA, eLORET, wMNE and beamformers (SAM and LCMV) are linear inverse problem solvers, which too heavily rely on raw lead fields. Such an overreliance on lead fields, in our opinion, is the main reason for the tendency of linear models to provide deep medial solutions for widespread, bilaterally synchronous neural sources, clearly evident in the case of KC localizations. Our current findings show that MFT is a suitable tool for noninvasive source localization of extended cortical sources, such as the sources of sleep slow waves and widespread epileptiform discharges (e.g. generalized spike/wave complexes).
4.3.2 Sensory Cortical Sources of the Auditory and Somatosensory Evoked KCs
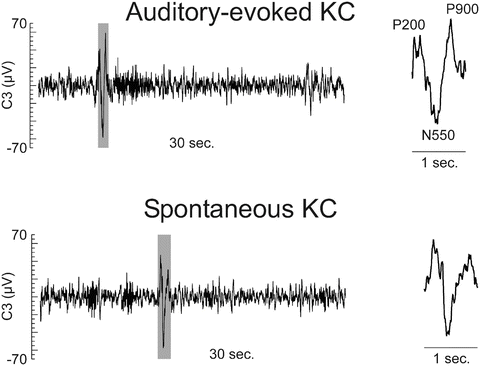
Figure 5.3 shows a typical (auditory) evoked KC used in the current study together with a spontaneous KC recorded in the same subject.


Fig. 5.3
Typical sensory-evoked (upper row) and spontaneous (lower row) KCs found in the current study. EEG signals from C3 electrode are shown in epochs of 30 s containing clear auditory-evoked and spontaneous KCs. The grey shaded period marks the KCs identified by a specialist. The insets on the right of each plot show the zoomed view of the marked KC (~1 s, shaded period). The conventional names of the tri-phasic evoked KC components are indicated next to each peak
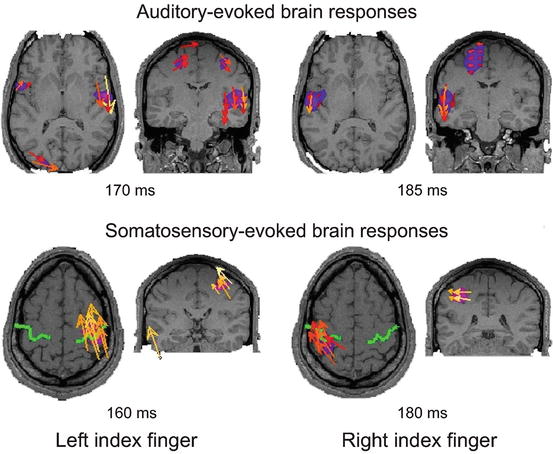
MFT was used to localize the neural sources of auditory and somatosensory evoked KCs from recorded MEG signals. At the earliest latencies within KCs, around the onset of P200 and 150–260 ms post-stimulus, brain activations were typically localized in the stimulation-related primary sensory cortex (Fig. 5.4).


Fig. 5.4
Typical localization of auditory (upper row) and somatosensory (lower row) evoked brain response around the onset of KCs. The strongest responses are shown on axial (left) and coronal (right) MRI slices at peak post-stimulus latencies indicated below the images. The current density vector (yellow and orange arrows) and its modulus (pink blobs) are plotted. In all cases only the values above 50 % of the instantaneous maximum are shown
That is binaurally presented sounds elicited strong activations in bilateral primary auditory cortex (Fig. 5.4, upper row), while activation in contralateral primary somatosensory cortex were found in response to electrical pulses delivered to index fingers and toes (Fig. 5.4, lower row). Following these responses in the primary sensory cortices, the activity rapidly spread to bilateral frontal cortex, peaking in frontal cortical brain areas found to underlie the spontaneous KCs.
These novel results clearly demonstrate that the earliest component of sensory-evoked KC is not stereotypic, but depends on the stimulated sensory modality. Moreover, using a robust and accurate source analysis method, MFT, we localized the earliest brain activation within the sensory-evoked KC in the stimulation modality-specific primary sensory cortex.
4.4 Conclusions
A careful study of sleep and especially of KCs may be very helpful in general epileptology research as well as clinic, while it is mandatory for the diagnosis and follow up of some particular nocturnal epilepsies. KCs are a cardinal feature to be taken into account in sleep stage scoring (hypnogram) and thereby realizing sleep quality metrics important for establishing possible effects of epilepsy and its medication on the patient’s sleep. It would further help distinguishing certain types of seizures like NFLE or the effect of sleep deprivation on others. Sleep studies of epilepsy constitute an important indication for ambulatory EEG home monitoring and will be greatly helped by developments like this of ARMOR.
The current results, together with the earlier studies [42–45, 47–50, 52, 53, 91] showing the excellent localization accuracy of MFT for focal as well as extended sources, and the smart uses of MEG and EEG in epilepsy discussed in Chap. 13, demonstrate that the MFT analysis of MEG signals can be a powerful tool for studying epilepsy and in pre-surgical evaluation. To realize MFT’s great potential for epilepsy, lengthy clinical studies are needed. The results suggest that it may be possible to eventually replace the invasive intracranial EEG procedures that are now necessary in epilepsy with MFT or some other (non-linear) method for localization of sources from MEG and possibly EEG data can.
References
1.
Wennberg R, Cheyne D (2013) On noninvasive source imaging of the human K-complex. Clin Neurophysiol 124:941–955CrossRef
2.
Vrba J, Robinson SE (2001) Signal processing in magnetoencephalography. Methods 25:249–271CrossRef
3.
Van Veen BD, Van Drongelen W, Yuchtman M, Suzuki A (1997) Localization of brain electrical activity via linearly constrained minimum variance spatial filtering. IEEE Trans Biomed Eng 44:867–880CrossRef
4.
Liu AK, Dale AM, Belliveau JW (2002) Monte Carlo simulation studies of EEG and MEG localization accuracy. Hum Brain Mapp 16:47–62CrossRef
5.
Pascual-Marqui RD (2007) Discrete, 3D distributed, linear imaging methods of electric neuronal activity. Part 1: exact, zero error localization. arXiv:0710. 3341
6.
7.
Taylor JG, Ioannides AA, Mueller-Gaertner HW (1999) Mathematical analysis of lead field expansions. IEEE Trans Med Imaging 18:151–163CrossRef
8.
Wennberg R (2010) Intracranial cortical localization of the human K-complex. Clin Neurophysiol 121:1176–1186CrossRef
9.
Loomis AL, Harvey EN, Hobart GA (1937) Cerebral states during sleep, as studied by human brain potentials. J Exp Psychol 21:127CrossRef
10.
Colrain IM (2005) The K-complex: a 7-decade history. Sleep 28:255–273
11.
Halasz P (2005) K-complex, a reactive EEG graphoelement of NREM sleep: an old chap in a new garment. Sleep Med Rev 9:391–412CrossRef
12.
Riedner BA, Hulse BK, Murphy MJ, Ferrarelli F, Tononi G (2011) Temporal dynamics of cortical sources underlying spontaneous and peripherally evoked slow waves. Prog Brain Res 193:201–218CrossRef
13.
Laurino M, Menicucci D, Piarulli A, Mastorci F, Bedini R, Allegrini P, Gemignani A (2014) Disentangling different functional roles of evoked K-complex components: mapping the sleeping brain while quenching sensory processing. Neuroimage 86:433–445CrossRef
14.
Roth M, Shaw J, Green J (1956) The form, voltage distribution and physiological significance of the K-complex. Electroencephalogr Clin Neurophysiol 8:385–402CrossRef
15.
Webster KE, Colrain IM (1998) Multichannel EEG analysis of respiratory evoked-potential components during wakefulness and NREM sleep. J Appl Physiol 85:1727–1735
Stay updated, free articles. Join our Telegram channel

Full access? Get Clinical Tree


