and Cheng-Ying Ho2
(1)
Pathology, Johns Hopkins University, Baltimore, Maryland, USA
(2)
Pathology, Children’s National Medical Center, Washington, D.C., District of Columbia, USA
General Considerations
Routine biomarkers in use in diagnostic neuropathology may be studied by a variety of techniques. Among these, immunohistochemistry has been the most extensively studied and applied to the evaluation of formalin-fixed paraffin-embedded (FFPE) tissues, the predominant form of tissue available for evaluation in surgical pathology. Given the sensitivity of in situ hybridization and reverse transcription polymerase chain reaction (RT-PCR), these techniques are also in routine use in molecular pathology laboratories for the identification of gene fusions, amplifications, and deletions with prognostic significance. However, with increasing refinement of molecular technologies, a variety of options exist currently for evaluation of molecular alterations in FFPE tissue for tumors. For example, array-based comparative genomic hybridization (CGH), single-nucleotide polymorphism (SNP), or methylation analysis can be currently applied for genomic alterations in FFPE tissues, techniques that provide a more comprehensive outlook at cytogenetic and epigenetic alterations. The simultaneous evaluation of multiple mutations using next-generation sequencing has also demonstrated increased use in oncology and facilitated the development of disease-specific, relevant gene panels.
Immunohistochemistry
The principles behind immunohistochemistry have been known for decades, but it was not until the 1980s and early 1990s that the technique found increasing applications for pathologic diagnosis. Hybridoma technology, based on the formation of hybrid cell lines, had a great impact in the field of immunohistochemistry, since it allowed the development of specific monoclonal antibodies on a large scale. Many of the early antibodies were designed to work on fresh frozen tissues, but most (if not all) diagnostically useful antibodies have been optimized for use in FFPE, the predominant archival form of tumor tissue at the present. When working with FFPE tissue, not only deparaffinization steps are required but also a variety of antigen retrieval methods (e.g., protein digestions, heat, citrate, EDTA) depending on how susceptible is the antigen “masked” through the process of FFPE archival.
The summary of the steps involved in immunohistochemistry is outlined in Fig. 2.1. In brief, an antibody recognizing a specific, usually protein, antigen is incubated with the tissue of interest. This is referred to as the primary antibody. These antibodies may be monoclonal or polyclonal and are developed by stimulating production in specific animals (commonly mouse, but also rat, rabbit, goat, or sheep). After this step, incubation with a secondary antibody recognizing the primary antibody and conjugated with a detection system is performed. Finally, a specific colorimetric method for detection is achieved through a reaction that depends on the detection strategy. At the present time, most routine immunohistochemical laboratories are equipped with automated machines that allow for higher volumes and efficiency of antibody testing.
Fig. 2.1
Steps involved in immunohistochemistry. The basic steps involved in immunohistochemistry for formalin-fixed paraffin-embedded tissues are illustrated. After deparaffinization, antigen retrieval is accomplished, followed by a blocking step to prevent nonspecific antibody-antigen reactions in tissue and nonspecific enzymatic reactions depending on the detection method. Incubation with the primary antibody directed against the antigen is performed, followed by incubation with a secondary antibody. The detection steps vary according to the technique. In this example the indirect biotin (B)-avidin (A)-horseradish peroxidase (Px) technique is used as an example, where a biotinylated secondary antibody is recognized by an avidin-peroxidase conjugate. A nuclear counterstain is applied to facilitate morphologic evaluation (e.g., hematoxylin). An anti-IDH1 (R132H) mutant protein immunostain in a secondary glioblastoma is illustrated
Immunohistochemistry for Routine Pathologic Diagnosis and Prognostication
Immunohistochemistry may be the single most common technique in routine use in diagnostic pathology. This allows for the study of proteins expressed by specific cell types (e.g., GFAP in astrocytes and astrocytic neoplasms). One caveat when interpreting immunohistochemical results in the nervous system is the development of nonspecific background staining, which may be problematic. Therefore, many antibodies optimized in tumor types may need to be optimized for the use in brain or spinal cord tissues. Some antibodies may work well in certain tissue types but need to be optimized further for application in brain tumors. Epithelial membrane antigen (EMA), for example, may stain well epithelial tissues and carcinomas but at similar concentrations may provide weak or even negative staining in meningiomas.
Traditional immunohistochemical markers in neoplastic neuropathology have focused on the detection of proteins of interest, specifically used in the differentiation of tumor types or in separating nonneoplastic tumor mimics. Specific differentiation lineages are also feasible to identify through immunohistochemistry. Examples include GFAP in astrocytes and glial neoplasms and synaptophysin, chromogranin, and NeuN as markers of neuronal differentiation in embryonal and glioneuronal tumors. Pattern of staining has also been traditionally useful in tumor identification. For example, EMA typically recognizes microlumina in ependymomas and demonstrates a “dot-like” pattern of staining [1].
With time, immunohistochemical stains have increasingly become useful biomarkers for the recognition of limited tumor amounts in small samples and for the identification of tumor suppressors or oncoproteins associated with disease severity. EGFR overexpression and PTEN protein loss are frequent markers of high-grade gliomas. Immunohistochemistry against p53 has been extensively used for the identification of isolated tumor cells in small biopsies and is of relative practical use in separating infiltrating astrocytomas (p53 positive) from oligodendrogliomas (p53 negative). Although p53 is considered a tumor suppressor protein, strong immunolabeling is associated with alterations in the pathway, including mutations that significantly increase its half-life and facilitate its detection. Loss of specific tumor suppressors is also of diagnostic and prognostic importance in neoplastic neuropathology. For example, INI1 protein loss in neoplastic cells is almost a diagnostic requirement for the identification of atypical teratoid rhabdoid tumors (ATRT). ATRX protein loss is usually associated with mutations in the corresponding gene [2] and is a frequent occurrence in the subset of infiltrating gliomas with astrocytic histology, particularly diffuse astrocytoma (WHO grade II), anaplastic astrocytoma (WHO grade III), and secondary glioblastoma (WHO grade IV) [3]. One caveat when interpreting these antibodies is that it is critical to identify preserved expression in nonneoplastic elements (e.g., endothelium, neurons) to make sure that the loss of expression is not secondary to tissue artifacts.
Currently, a great application of immunohistochemistry in the identification of biomarkers is the development of antibodies that not only recognize increased or decreased protein levels, but that are designed specifically to recognize mutant versions of a protein. In neoplastic neuropathology, one of the earlier applications of mutation-specific antibodies was the development of anti-EGFR vIII antibody. This recognizes a mutation in EGFR that leads to truncation of its extracellular domain, occurs in a subset of glioblastoma, and is often associated with EGFR amplification. This represents an excellent example of immunohistochemical biomarker development in neuro-oncology since there are specific clinical trials with anti-EGFR vIII therapy that require the presence of EGFR vIII for enrollment. One limitation is that ant-EGFR vIII antibodies are not widely available, and alternative molecular methods (e.g., PCR) may be required for its detection.
One of the most useful advances in the evaluation of diffuse gliomas in years has been the incorporation of IDH1 (R132H) immunohistochemistry. This antibody recognizes the most common mutation (~85 %) occurring in diffuse gliomas. It is a marker with diagnostic significance, allowing, for example, the separation of IDH1 mutant gliomas from nonneoplastic mimics (e.g., gliosis) [4]. It also has prognostic significance, since high-grade gliomas with IDH mutations have a better prognosis than IDH wild-type tumors. Examples of other mutation-specific antibodies applicable to neoplastic neuropathology include BRAF (V600E), useful in the evaluation of pleomorphic xanthoastrocytoma [5] and ganglioglioma [6] in particular. More recently, antibodies specific for H3.3 K27M histone mutant protein are of great practical use in recognizing the pediatric diffuse gliomas that carry this mutation [7, 8]. Interestingly, this mutation also occurs at a higher frequency in high-grade gliomas occurring in the spinal cord [9].
In Situ Hybridization
In situ hybridization is a molecular technique that takes into account the complementarity of nucleic acids for target identification. Regarding the detection method for the signals, it can take the form of fluorescence in situ hybridization (FISH) or chromogenic in situ hybridization (CISH). With respect to nucleic acid detected, it may be applied to DNA which represents the predominant clinical use but also may be modified to detect mRNA or small RNAs.
Fluorescence In Situ Hybridization (FISH)
FISH is a technique with widespread applications in many cytogenetic and molecular pathology laboratories. With this technique, DNA probes targeting regions of interest are labeled with various fluorophores and are hybridized to whole cells or, more commonly, to FFPE sections of tumor (Fig. 2.2). One of the main advantages of FISH is that it preserves morphology and architecture, and specific alterations may be mapped to areas of the tumor identifiable on histologic sections. The technique has high sensitivity and is ideal for identification of alterations in small tissue sections or present in focal regions of the tumor [10]. Therefore, FISH has found increasing applications for the study of genetic heterogeneity in brain cancer and is able to detect mutually exclusive receptor tyrosine kinase amplifications in different cells within the same tumor [11].
Fig. 2.2
Fluorescence in situ hybridization (FISH). After deparafinization, a protein digestion is required to allow appropriate access of the nucleic acid probe to the target of interest. Target probes (red) and control probes (green) are labeled with appropriate fluorophores and used in the hybridization process. A fluorescent nuclear stain (e.g., DAPI) is used, and after coverslip, the slide is ready to view under a fluorescence scope using appropriate filters. An example of a FISH experiment for PTCH1 (red) and a 9q control probe (green) is shown demonstrating 9q loss in a sonic-hedgehog medulloblastoma subtype. In neoplastic neuropathology, the FISH patterns that may be seen with individual probes include deletions/monosomies, low-level gains/duplications and amplification (high-level illustrated)
Regarding routine tissue sections, establishing appropriate tissue cutoffs for FISH is essential, since truncation/sectioning artifacts leading to erroneous calls for chromosomal/region loss are possible. Establishment of specific cutoffs should be established and validated for every new probe implementation. This is performed in practice by developing, among other variables, target probe (region) to control ratios. Centromere enumerating probes (CEP) represent frequent control probes available commercially for almost every chromosome. In neoplastic neuropathology, FISH has found applications particularly in the identification of regions of chromosome loss as well as gains (e.g., amplifications). It is a technique also suitable for the identification of specific gene rearrangements.
Chromogenic In Situ Hybridization (CISH)
CISH is a technique that combines principles of FISH and immunohistochemistry (Fig. 2.3). One of its advantages over FISH is that archival slides are produced that may be examined under light microscopy as any routine immunohistochemical stain [12]. Problems with gradual fading of fluorescence signals over time may therefore be bypassed at least in part, and the slides may be read simultaneously or sequentially by more than one observer with ease. Furthermore, less sophisticated equipment is required for interpretation, unlike FISH which requires a fluorescence scope with appropriate filters and a camera. CISH is becoming a suitable alternative to FISH in many laboratories. It also is more versatile than FISH regarding nucleic acid identification (e.g., DNA, mRNA, microRNA). CISH is currently applicable to the study of DNA copy number alterations in brain tumors [13]. In neoplastic neuropathology, it is highly suitable for the identification of gene amplification [14], such as EGFR amplification in glioblastoma [15, 16], but also may be applied to the identification of losses in tumor suppressor genes. It is a technique that has been extensively applied to pathogen identification in tissue. Regarding neoplasms and pseudoneoplastic mimics, one of its main widespread applications focuses on the identification of EBV-encoded RNA (EBER) in post-transplant and immunosuppression-related lymphoproliferative disorders and JC virus in progressive multifocal leukoencephalopathy (PML).
Fig. 2.3
Chromogenic in situ hybridization (CISH). Chromogenic in situ hybridization uses in situ hybridization in combination with immunohistochemistry techniques. After deparafinization, a protein digestion is required to allow appropriate access of the nuclei acid probe to the target of interest. This is followed by the actual hybridization with the target using a labeled probe (e.g., with DIG) for detection by a variety of methods. Since antibody-antigen reactions are used in the formation of chromogen, a blocking step is required. In this example an alkaline phosphatase (AP) enzyme is conjugated to an antibody specific for the probe label. A detection method follows (in this example NBT-BCIP which creates a blue precipitate), and after this, a counterstain is applied, and the slide is ready for review by light microscopy. In this actual example, CISH for microRNA (miR-124) demonstrates a cytoplasmic localization in cerebral cortical neurons
In Situ Hybridization for Routine Pathologic Diagnosis and Prognostication
In situ hybridization, particularly FISH, has found numerous applications in neuro-oncology for diagnosis, prognostication, and therapeutic prediction. In this section we provide specific examples of some of the most frequent and valuable biomarkers that are tested routinely by in situ hybridization. Additional details are provided in the tumor-specific chapters.
EGFR and PTEN
As mentioned above, oncogene amplifications (e.g., EGFR) are ideally suited for testing by FISH and CISH. This is related in part to the ease of recognition of multiple gene copies by these techniques, even if the alteration is limited to a subset of tumor cells. Testing for EGFR amplification is performed in many specialized laboratories, although as a prognostic marker it has limited utility in neoplastic neuropathology. Some studies have reported an association with worse prognosis, particularly in older patients [17]. Diagnostically, it is helpful in the identification of some prognostically unfavorable glioma variants. For example, small cell astrocytoma has a high frequency of EGFR amplification [18], one of the molecular features that distinguishes it from the more favorable oligodendroglioma. Even in the absence of amplification, EGFR FISH is helpful to identify gains in chromosome 7, which are more frequent in diffuse gliomas, and may aid in the separation of infiltrating astrocytomas from reactive gliosis [19]. Another setting in which EGFR FISH analysis may be useful is in cases in which a glioblastoma is poorly sampled, and the histologic assessment satisfies criteria only for a grade II or grade III. In this instance, the presence of EGFR amplification suggests more aggressive biology and a tumor that indeed will behave more as a glioblastoma than a lower-grade glioma [20].
PTEN FISH has also been applied in many laboratories to the characterization of brain tumors. Some investigators have proposed testing for PTEN deletions by FISH as an important prognostic factor in glioblastoma [21], although it is not an independent prognostic marker in all studies [22]. PTEN deletions have also been reported in a subset of pilocytic astrocytomas with anaplastic changes [23]. It must be noted that PTEN FISH is more properly a marker for chromosome 10q arm loss rather than the PTEN gene alone, given the presence of other putative tumor suppressor genes in this chromosome arm, e.g., DMBT1.
CDKN2A
CDKN2A (p16) loss is frequent in diffuse astrocytomas, and interestingly loss is usually in the form of large homozygous deletions which are identifiable by FISH with relative ease, as long as internal controls are properly studied to prevent false positives secondary to poor hybridization. Although the prognostic significance of CDKN2A deletion in glioblastoma is unclear, recent studies have demonstrated a possible application to prognostication of lower-grade diffuse astrocytomas where this alteration is associated with shorter survival [24]. In the field of pediatric low-grade gliomas, CDKN2A deletions have been associated with shorter progression-free survival [25]. Homozygous CDKN2A have also been identified in a subset of pilocytic astrocytomas with anaplasia [23].
1p19q
The identification of combined 1p19q losses in diffuse gliomas was one of the most significant biomarkers developed for prognostication in these tumors. Initial observations highlighted an association with oligodendroglial morphology in diffuse gliomas [26, 27] and subsequently were associated with better prognosis and increased responsiveness to chemotherapy [28]. This has been independently confirmed by the results of extended follow-up in clinical trials [29, 30], and therefore 1p19q testing remains essential for routine treatment and clinical trial enrollment in oligodendroglioma. Although 1p19q co-deletion may be tested by a variety of molecular techniques, including loss of heterozygosity and array-based techniques, FISH remains the most widely applied method for its detection.
One particular use of 1p19q testing, particularly in combination with IDH1 and IDH2 mutation analysis, is separation of oligodendroglioma from other similar tumors characterized by the presence of clear cells, such as dysembryoplastic neuroepithelial tumor, central neurocytoma, and clear cell ependymoma, which generally lack these alterations [31]. The only caveat is that oligodendrogliomas that occur in children frequently lack 1p19q co-deletion [32], in contrast to similar tumors in adults, and therefore may represent a distinct entity at the molecular level.
Another advantage of examining 1p19q by FISH is that it allows for the assessment of relative deletions caused by polyploidy, which may have additional prognostic relevance [33]. More recently some laboratories have reported excellent performance for 1p19q testing by CISH, a more user-friendly technique as described above [12].
MYC
MYC and MYCN are two powerful oncogenes that are amplified at various rates in tumors of the nervous system, particularly those in the embryonal category, including neuroblastoma, retinoblastoma, and medulloblastoma. As mentioned above, FISH is an excellent technique for identification of gene amplifications in tissue sections, including MYC. Amplifications of these oncogenes have prognostic significance in specific settings and may affect clinical trial inclusion criteria. MYC amplification and overexpression, for example, occur in a subset of medulloblastoma, where it is associated with unfavorable histology (i.e., anaplastic/large cell) and with a worse prognosis [34]. Conversely, NMYC amplification is more frequent in neuroblastoma [35], where it is also associated with a worse prognosis.
BRAF
Duplications of the BRAF oncogene kinase domain, leading predominantly to a KIAA1549:BRAF fusion, are the most frequent recurrent alteration in pediatric gliomas, particularly pilocytic astrocytoma. Given the close proximity of the duplicated and fused areas, testing for this alteration on a clinical basis may be challenging, particularly in FFPE. FISH has also proven of value in the identification of this alteration, when looking at duplication of the BRAF kinase domain, or the actual KIAA1549:BRAF fusion [36, 37].
C19MC
MicroRNAs are small RNA molecules that play an important role in transcription and translation regulation in a variety of cell processes and are frequently dysregulated in cancer. Amplification of microRNA clusters may occur in specific tumors types. In pediatric brain tumors, amplification of the C19MC microRNA cluster (19q13) has emerged as a diagnostic and prognostic biomarker in a subset of embryonal neoplasms, particularly the prognostically unfavorable group associated with rosettes (embryonal tumor with multilayered rosettes, ETmR), including the embryonal tumor with abundant neuropil and true rosettes, and medulloepithelioma [38]. This alteration is easily identifiable with a FISH strategy [39].
Multiplex Ligation-Dependent Probe Amplification (MLPA)
MLPA is a technique that has found some applications in neuro-oncology although it is not in widespread use in molecular labs. It has advantages over other hybridization-based techniques in that it allows the detection of deletion or duplication of single exons, but it is also applicable to large areas of chromosomal deletion. It also works with small amounts of tissue, even FFPE. In this technique, specific probe pairs added to the sample (rather than DNA sequences present in the sample) are amplified [40]. In neuro-oncology, it has been applied to the detection of monosomy 6 in medulloblastoma [41] and 1p19q deletions in oligodendrogliomas [42]. In addition, MLPA has also some applications in germline testing for specific syndromes such as neurofibromatosis type 1 (NF1) [43] and rhabdoid tumor predisposition syndrome (RTPS) [44].
Comparative Genomic Hybridization (CGH) and Single-Nucleotide Polymorphism (SNP)-Based Arrays
Comparative genomic hybridization array (array CGH) is a molecular cytogenetic technique used to detect copy number variation (CNV) and loss of heterozygosity (LOH) in one assay. It offers a high-throughput, high-resolution analysis of the entire genome. Array CGH not only can assess numerical chromosome changes, because of its resolution it is also capable of detecting smaller genetic alterations, such as duplications and deletions of DNA. Array CGH has a resolution of 5–20 megabases, which is much higher than cytogenetic methods, such as conventional karyotyping and fluorescence in situ hybridization (FISH) [45]. The data allows for identification of tumor-specific oncogenes (through gain of material, e.g., MYC amplification) and tumor suppressor genes (through loss of material, e.g., CDKN2A deletion). It can also be used to molecularly subclassify tumors. In array CGH, the sample (i.e., tumor) and reference (i.e. normal control) genomic DNA are differentially labeled with two fluorochromes before being hybridized onto a microarray containing thousands of cloned DNA fragments from bacterial artificial chromosomes (BACs). The microarray will then be scanned to measure the fluorescent signals, the ratio of which reflects the differences between the two DNA sources [46] (Fig. 2.4). A higher intensity of the test sample color in a specific region of a chromosome indicates a gain of material of that region, whereas a higher intensity of the reference sample color indicates a loss of material in that region [47]. The result is usually plotted as tumor vs. normal log2 ratio (Fig. 2.5) to display the gains and losses of material along the baseline.
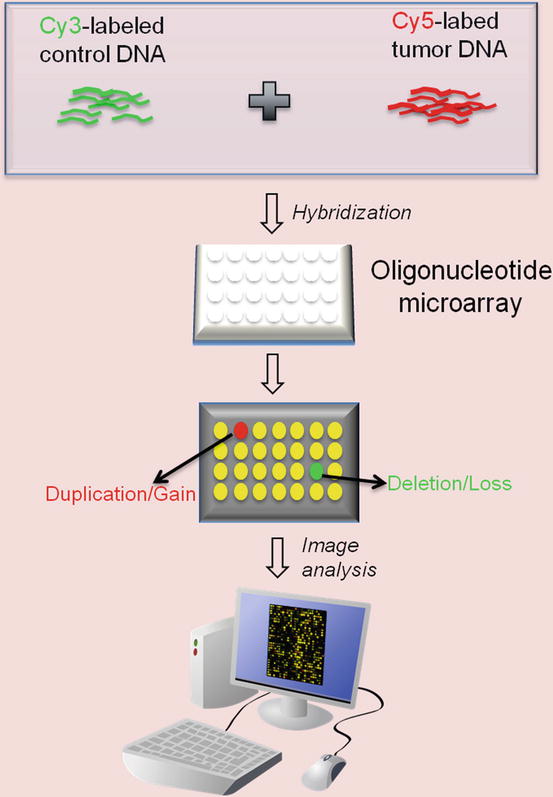
Fig. 2.4
Array Comparative Genomic Hybridization (CGH) process. Control and tumor DNA are labeled with Cy3 and Cy5, respectively, and then hybridized to an oligonucleotide array. After hybridization, the array is scanned to measure the intensity of the two fluorophores. The ratio of Cy3 to Cy5 represents copy number differences between the two DNA samples
Fig. 2.5
Array Comparative Genomic Hybridization (CGH) profile. Probes with log2 ratios above the baseline are interpreted as gains of material. This plot represents gene duplication
A major limitation of array CGH is that it is only able to detect unbalanced chromosome abnormalities. It does not provide information about copy-neutral loss of heterozygosity (CN-LOH) or acquired uniparental disomy (aUPD) events, such as mitotic recombination or gene conversions [48]. Due to its limitation, in recent years array CGH has been largely replaced by high-density single-nucleotide polymorphism-based arrays (SNP arrays), which are capable of detecting CN-LOH. CN-LOH is a form of allelic imbalance. In CN-LOH or aUPD, one allele or one whole chromosome is missing, whereas the other allele/chromosome is duplicated. CN-LOH can be pathological if the wild-type allele is missing and the mutant allele is duplicated. CN-LOH is prevalent in neoplasms, reported to constitute 50–80 % of the LOH in human tumors [49, 50]. For instance, approximately half of the LOH events in glioblastomas are copy neutral [51].
The basic principle of SNP array is very similar to array CGH. SNP refers to a common DNA sequence variation at a single base pair. There are approximately ten million SNPs in the human genome [52]. SNP array is a DNA array that contains allele-specific oligonucleotide (ASO) probes to detect a single-nucleotide difference in the sequence of sample DNA. Two probes must be used for each SNP position to evaluate both alleles. SNP array is a useful tool to study slight variations between genomes. It is commonly used in constitutional cytogenetics (the study of genetic aberrations and their link to hereditary disorders) as well as cancer cytogenetics.
The popular commercially available SNP array platforms at the present time include Affymetrix Genome-Wide Human SNP Array (Santa Clara, CA), Illumina GoldenGate BeadChip Assay (San Diego, CA), Agilent SurePrint CGH + SNP Microarray (Santa Clara, CA), and Roche Nimblegen AccuSNP Array (Madison, WI). The Affymetrix SNP arrays have evolved from the earlier version of GeneChip 10 K with 10,000 SNP markers to the most recent 6.0 version featuring 1.8 million genetic markers, including more than 906,600 SNPs and more than 946,000 CNV markers. 25-mer probes are synthesized as perfect matches (PM) and as one-base mismatches (MM). A perfect match for each of the two SNP alleles (A, B) and one mismatch for each of the two alleles with the nucleotide in question at a given position are referred to as a probe quartet. Affymetrix arrays take the “complexity reduction” polymerase chain reaction (PCR) approach: Genomic DNA is digested with restriction enzymes and ligated to common adaptors. A universal primer that recognizes the adaptor sequence is used to amplify adaptor-ligated DNA fragments. This approach allows for the amplification of thousands of DNA fragments with one PCR primer pair in a single reaction [53]. Amplified DNA is then fragmented, labeled, and hybridized to the array for scanning and analysis. In Illumina GoldenGate Assay, two allele-specific oligos (ASOs) are hybridized directly to genomic DNA bound to paramagnetic particles. In case of a perfect match, the primer is extended, and the extension product is ligated to a locus-specific oligo (LSO), a probe hybridized several bases downstream from the SNP site. All three oligo sequences contain regions of genomic complementarity and universal PCR primer sites; the LSO also contains a unique address sequence that targets a particular bead type. The ligated product is amplified by PCR using universal primers that are fluorescently labeled. After PCR, the fluorescently labeled amplified products are captured on the complement bead type through their unique address sequences. The fluorescent signals will then be analyzed by software (Figs. 2.6 and 2.7).
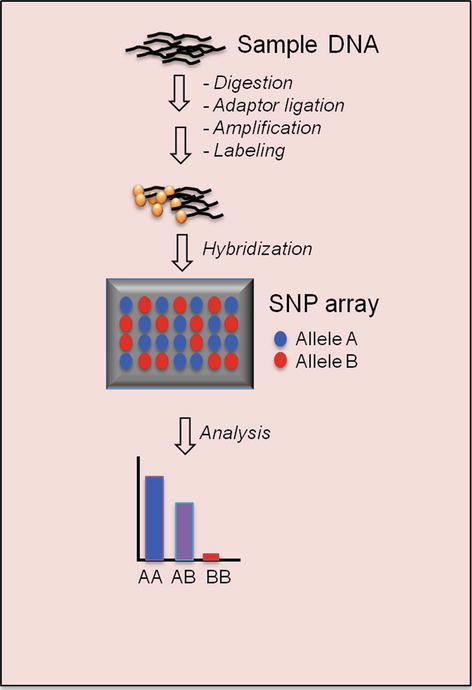
Fig. 2.6
Single-nucleotide polymorphism (SNP) array process
Fig. 2.7
Single-nucleotide polymorphism (SNP) array result. The top plot shows the Log2 ratio, and the bottom plot demonstrates the allele difference for each SNP marker aligned to its chromosomal position. In the top plot, the dots above the baseline represent gains of material (duplication), whereas the dots below the baseline are interpreted as losses of material (deletion)
Gene Expression Profiling
Gene expression profiling is a method that systematically and simultaneously measures gene activity in order to differentiate abnormal from normal cellular function. It uses various techniques to quantify the amounts of messenger RNA (mRNA), the transcript of a gene. By comparing tumor versus normal expression patterns, gene profiling can identify novel disease entities and provide valuable insights into gene dysregulation in neoplastic processes. The relatively simple data analysis algorithms and rapid turnaround time also give it an edge over complex sequencing procedures such as RNA-seq, whole exome, or whole-genome sequencing. Gene expression profiling can focus on a panel of target genes or analyze thousands of genes simultaneously to create a snapshot of the gene regulatory networks. The commonly used techniques for gene profiling are discussed below.
DNA Microarray
DNA microarray is a microchip containing thousands of short (25-mer) oligonucleotide probes. There are multiple probes representing each gene to allow sensitive detection of mRNA from samples. The most popular commercial product is Affymetrix GeneChip. Affymetrix GeneChip uses a set of 11–20 probes per gene. Each probe pair consists of a perfect match (pm) and a mismatch (mm) probe. The pm probe has a sequence exactly complimentary to a given gene, whereas the mm probe contains a single base substitution in the 13th base to measure the nonspecific cross-reactivity. The differences in hybridization signals between the pm and mm probe, measured by fluorescence intensity ratio, serve as indicators of target gene abundance (Fig. 2.8) [54]. The Affymetrix GeneChip instrument system consists of the microarray chip, hybridization oven, fluidics station, computer workstation, and scanner. The entire procedure is summarized in the schematic overview (Fig. 2.9). In brief, total RNA is extracted from cells or tissue and converted to cDNA through reverse transcription. The cDNA is transcribed back to cRNA, labeled with biotin, and fragmented to 30–400 bp long. The biotinylated cRNA fragments will be applied to the microarray for hybridization. After removing the unbound cRNA through washes, the array will be stained with fluorescent molecules that bind to biotin (e.g., Cy5- or Cy3-conjugated streptavidin). The array chip will then be scanned with a laser for quantitative analysis of gene expression [55].
Fig. 2.8
GeneChip expression array design. mRNA is detected by the paired probe set PM and MM that differ in only one nucleotide. After hybridization, the array is stained with fluorescent molecules and scanned with laser
Fig. 2.9
DNA microarray (GeneChip) process
Gene expression data are usually presented in a matrix on which each row represents a single gene and each column represents one sample. After log2 transformation, the raw data will be filtered to remove genes that have very low levels of expression or are not differentially expressed. Alterations in gene expression are color-coded and represented by a “heat map” diagram: expression is color-coded more often in green for lower levels and red for higher levels. To further classify the gene expression data from various samples, algorithms such as hierarchical clustering or K-means clustering are used. Hierarchical clustering searches the distance matrix for the pair of genes that have the smallest distance between them and merges these two genes into a cluster (Fig. 2.10). Genes with similar expression patterns are grouped together and are connected by a series of branches, i.e., hierachichal clustering tree or dendrogram. In addition to the connectivity-based hierarchichal clustering, the K-means algorithm is another commonly used clustering analysis method. The K-means algorithm divides a dataset into non-overlapping clusters by assigning each record to the nearest centroid (cluster) (Fig. 2.11) [56].
Fig. 2.10
Hierarchical clustering analysis. The result is demonstrated as dendrograms on the top and left of the heat map
Fig. 2.11
K-means clustering algorithm
Serial Analysis of Gene Expression
Serial analysis of gene expression (SAGE) is a comprehensive and quantitative measure of gene expression. It analyzes the gene transcripts by sequencing a library of short (9–10 bp) nucleotide sequence tags that are ligated together [57, 58]. Each sequence tag represents a gene transcript. The number of times each tag is detected correlates with the expression of the corresponding gene transcript (Fig. 2.12). It has an advantage over microarrays in that the method does not have multiple sources of variability. It can also detect transcripts of low expressors that may be filtered out by the post-array analysis.
Fig. 2.12


Serial analysis of gene expression (SAGE) process. cDNA is synthesized from poly (A)+RNA using the oligo-dT primers and then cleaved by an “anchoring” restriction enzyme. The cDNA fragments are subsequently ligated to linkers containing the recognition site for a “tagging” restriction enzyme. Digestion by the tagging enzyme releases short cDNA fragments (tags) attached to the linkers. The linker-tag molecules are ligated to form ditags and amplified by PCR, followed by anchoring enzyme digestion to release the tags from the linkers. The tags are ligated to form concatemers and cloned into a vector for sequencing. The abundance of each tag reflects the expression level of its corresponding gene
Related posts:


Stay updated, free articles. Join our Telegram channel
Full access? Get Clinical Tree
