Fig. 12.1
Photographs of Japanese small game fowl in the control (a) and the operated group (b).Roentgenograms of its cervical lateral views in the control (c) and operated group (d). Severe kyphotic deformity was observed at the mid-cervical lesions in the operated group (arrow head) because the animals tries to keep their heads upright and parallel to the ground

Fig. 12.2
(a) Photograph of the dissected spine and spinal cord tissues. (b) Measurement of kyphotic angle
12.3 Progressive Kyphosis of the Cervical Spine Caused Compression of the Cervical Spinal Cord
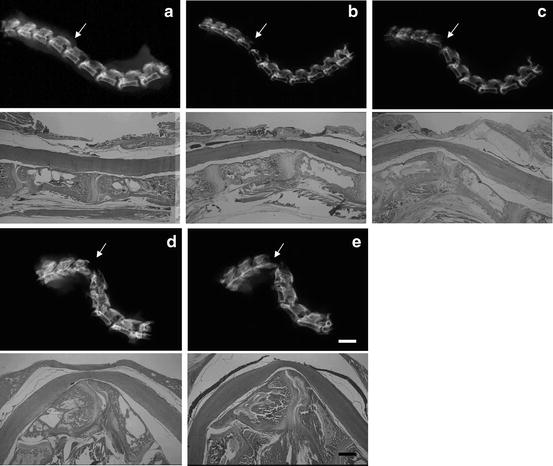
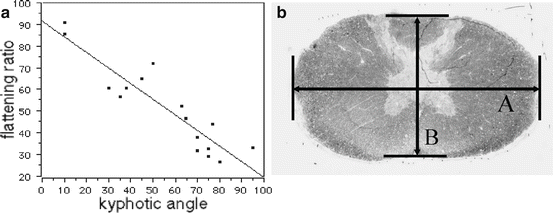
While the control animals maintained straight alignment of the middle cervical spine (Fig. 12.3a), the animals in the operated group developed severe kyphotic deformity in the middle cervical spine with hyper lordosis of the lower cervical spine to keep their head upright (Fig. 12.3b–f). Their kyphotic deformity progressed intensively with time until 3 weeks after the surgery and stabilized thereafter. The mean kyphotic angle was 51.6 ± 5.0° in the operated group at 8 weeks after surgery and 14.2 ± 2.8° in the control group. Intramedullary hemorrhage and giant cavities, which are characteristics of acute compression, were not observed in this model. At the apex of the kyphosis, the spinal cord was compressed severely, and spinal cord flattening was most evident. There was a strong negative correlation between the kyphotic angle of the cervical spine and the spinal cord flattening ratio (r = −0.913) (Fig. 12.4). None of the animals, however, developed apparent motor paralysis during the postoperative observation period. In the previous animal studies, the reproducibility of the occurrence of delayed paralysis was poor, and it has been shown that delayed paralysis developed only after spinal cord compression became very severe, that is, compression due to stenosis of 50 % or more of the spinal canal [5, 6]. This finding is consistent with the finding in patients with OPLL or neurofibromatosis (which causes very severe spinal cord compression due to kyphosis) and patients with cervical spondylotic myelopathy [8]. On the other hand, kyphosis, in general, is more likely to cause paralysis than scoliosis [9–12]. However, it is still unknown to date as to what severity of kyphosis may be associated with delayed spinal cord paralysis. Several investigators have reported that the critical kyphotic angle at which paralysis is likely to occur was between 80° and 90° [13, 14]. This issue remains to be addressed in the future.


Fig. 12.3
Changes in kyphotic deformities of cervical spine after surgery. As the birds grew, kyphotic deformity progressed until 3 weeks, which were maintained thereafter. (a) 1 day, (b) 3 days, (c) 1 week, (d) 3 weeks, and (e) 8 weeks after the surgery (arrows: C4–5 level). The spinal cord was compressed ventrally due to vertebral deformity. Bar in (e) is 2.5 mm in the upper row of (e), 1 mm in the lower row of (e)

Fig. 12.4
(a) Flattening ratio (%) was calculated by B/A × 100 (%) (A: transverse diameter, B: anteroposterior diameter). (b) Correlation between the kyphotic angle and the spinal cord flattening ratio. There was a strong negative correlation between kyphotic deformity and spinal cord flattening ratio (r = −0.913)
12.4 Progressive Kyphotic Deformity Caused a Loss of Motor Neurons and Demyelination
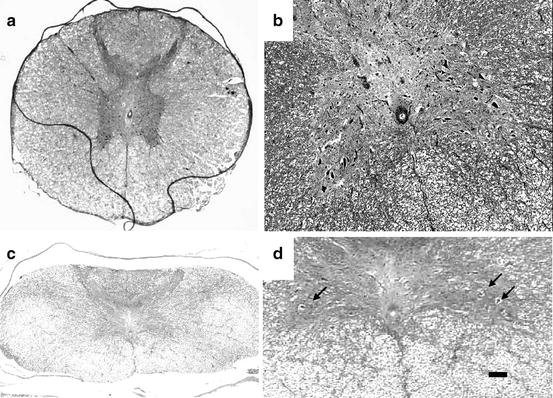
In some animals, spine and spinal cord tissues were embedded in paraffin, cut into sagittal sections together after rapid demineralization, and stained with hematoxylin and eosin (HE). While there were abundant motor neurons with large soma at the lamina IX in the control group (Fig. 12.5a, b), their number decreased in the operated group and the spared motor neurons showed severe atrophy (Fig. 12.5c, d: arrows). In the operated group, severe demyelination was observed in the anterior funiculus (Fig. 12.6a), and no such changes were found in the control groups (Fig. 12.6b). Demyelination in the posterior funiculus of the operated group was mild and difference between the two groups was less obvious (Fig. 12.6c, d). Myelin area ratio (MAR), which indicates the percent of the area of the myelin sheath relative to the total area of each captured image, was calculated. The average MAR in the anterior funiculus were 27.6 ± 5.2 % and 24.5 ± 4.7 % at 4 and 8 weeks after the surgery, respectively. There was a negative correlation between the kyphotic angle and the MAR of the anterior funiculus at both 4 week (r = −0.881) and 8 week (r = −0.883) after the surgery. The average MARs the lateral funiculus were 32.3 ± 4.7 % and 30.2 ± 3.6 % at 4 and 8 week after the surgery, respectively. There was a week negative correlation between the kyphotic angle and the MARs of the lateral funiculus at both 4 week (r = −0.884) and 8 week (r = −0.897) after the surgery. In contrast, the average MARs of the posterior funiculus were 40.4 ± 3.0 and 35.4 ± 3.0 at 4 and 8 week after the surgery, respectively. There was no significant correlation between the kyphotic angle and MARs of the posterior funiculus at either 4 week (r = −0.587) or 8 week (r = −0.444) after the surgery. Taking these results together, demyelination of the compressed white matter due to kyphotic deformity progressed in the order of anterior, lateral, and posterior funiculus; the posterior funiculus tended to be preserved even in the cases of severe compression (Fig. 12.7). The anterior funiculus in the operated group, which was the most extensively compressed, showed most marked histological changes such as demyelination and irregularity of the spared myelin sheath. The loss of the axons and vacuole formation were also apparent (Fig. 12.8a, b) compared to the control animals (Fig. 12.8c, d). Deformation of the myelin sheath surrounding the spared axons and recruitment of reactive astrocytes and macrophages were also observed (Fig. 12.8b)


Fig. 12.5


Photomicrographs of anterior horn in the control (a) and the operated groups (b: kyphotic angle 95°). Fewer motor neurons in lamina IX at the anterior horn were observed in the operated group compared to the control group (hematoxylin and eosin staining). Bar is 200 μm in (a, c) and 100 μm in (b, d)
Stay updated, free articles. Join our Telegram channel

Full access? Get Clinical Tree


