Structural Magnetic Resonance Imaging
J. Suckling
E. T. Bullmore
Introduction
Magnetic resonance imaging (MRI) is a versatile and evolving technology for visualizing the structure, function, and metabolism of the living human brain. All kinds of MRI data can be acquired without exposing subjects to ionizing radiation or radioactive isotopes. Installing the hardware for MRI represents a major capital investment, of approximately £1.5 million. For these three reasons of versatility, safety, and (relative) affordability, MRI continues to be the dominant brain-imaging technique in psychiatric practice and research.
In this chapter, we introduce the principles and practicalities of MRI and describe common methods of structural MRI data acquisition and analysis. Chapter 2.3.8 on functional MRI provides greater detail on statistical issues arising in image analysis.
Magnetization
If iron filings are scattered on a piece of paper they will be oriented at random. If a bar magnet is then placed under the paper, the iron filings will align themselves so that each filing lies parallel to the magnetic field produced by the magnet. More technically, we can say that iron filings have a susceptibility to be magnetized by a static magnetic field.
Susceptibility refers both to the effect of a magnetic field on an object, and the effect of that object on the field. Paramagnetic materials, like some metals, tend to be attracted by magnets and cause a local increase in the magnetic field strength. Diamagnetic materials, like carbon and many organic compounds, tend to be repulsed by magnets and cause a local decrease in field strength.
The brain also has a susceptibility to be magnetized. It is largely composed of water and each molecule of water comprises, of course, two hydrogen atoms and one oxygen atom. The hydrogen nucleus is a single positively charged proton, which has a dynamic property called spin. Like all moving charged particles, spinning protons generate a magnetic field. The axis of the magnetic dipole generated by a spinning proton is sometimes called its magnetic moment, and is drawn as a vector.
When the brain is placed in a strong magnetic field, the spinning protons align themselves with the external field, just as iron filings align themselves to the field of a bar magnet. The angle of alignment between each proton’s moment and the (longitudinal) axis of the external magnetic field is α. Protons obey the laws of quantum mechanics, and so two modes of alignment or spin states are possible, one with the magnetic moment in the direction of the field (α = 0°) and one with the moment in the opposite direction (α = 180°). Depending on the strength of the applied field, the spin states have slightly different probabilities, with those protons aligned in the direction of the field in excess by about 5 ppm at an external field strength of 1.5 T. (Magnetic field strength is measured in units of gauss (G) or tesla (T): 1 T = 10 000 G. The earth’s magnetic field is approximately 0.5 G; a child’s toy magnet has a field of around 10 G.)
Thus, if the magnetic moments for all spinning protons are averaged, the net, or bulk, magnetization vector for the brain as a whole will have α = 0°. The length of the net magnetization vector then represents the strength of longitudinal magnetization (Fig. 2.3.7.1).
Protons aligned with a static magnetic field are not static themselves, they rotate or precess at very high frequency around the axis of the external field. The precession frequency, or Larmor frequency, is constant for a given type of atomic nucleus and external field strength. For protons, the Larmor frequency at 1.5 T is 63.9 MHz. However, although all hydrogen nuclei in the brain precess at the same frequency in the same field, they will not all precess with the same phase. At any given time, different nuclei have reached a different point in their rotation around the external field axis.
Nuclear magnetic resonance
When a wineglass is tapped by a knife, it produces a high-pitched sound of characteristic frequency. If a singer can exactly match that frequency with her voice then the glass will resonate and may break. The basic idea is that if an object has a characteristic frequency of oscillation, exposing it to energy precisely at that frequency will cause a change in physical state.
Analogously, if we supply a pulse of radio-frequency energy at (and only at) the Larmor frequency to a brain located in a magnetic field, the protons within the brain will absorb the energy and resonate—this is nuclear magnetic resonance (NMR)—and their angle of alignment α with the external field will increase. If sufficient energy is supplied to cause α = 90°, the radio-frequency pulse is called a ‘90° pulse’. If the net magnetization vector is flipped to an angle α = 180°, the radio-frequency pulse is called a ‘180° pulse’. At the same time as the angle of alignment is increased by radio-frequency irradiation, the phase of precession becomes coherent over all protons. In other words, in place of the random variation in the phase of precession that existed before the radio-frequency pulse, protons are now ‘marching in step’ with each other around the axis of the external field.
After the radio-frequency pulse has ceased, the resonating nuclei gradually relax back to the equilibrium state of random precession in alignment with the external field. The two components of this relaxation process are characterized by relaxation times. The first relaxation time (T1), also called the spin-lattice relaxation time, describes the time taken for the strength of longitudinal magnetization to return to 63 per cent of its value before radio-frequency irradiation. This is a measure of the time taken for α to return to zero having been flipped to 90° or 180°. T1 is determined by interactions between protons and their long-range (molecular) environment
or lattice. The second relaxation time (T2), also called the spin-spin relaxation time, describes the time taken for the flipped nuclei to stop ‘marching in step’ around the axis of the field. This process of dephasing begins as soon as the radio-frequency pulse stops, but its rate is determined by the immediate (atomic) environment of the protons. Small variations in the applied magnetic field accentuate spin-spin relaxation, resulting in an observed relaxation time T2* which is somewhat faster than the ‘true’ relaxation time T2 that would have been observed in an ideally homogeneous field.
or lattice. The second relaxation time (T2), also called the spin-spin relaxation time, describes the time taken for the flipped nuclei to stop ‘marching in step’ around the axis of the field. This process of dephasing begins as soon as the radio-frequency pulse stops, but its rate is determined by the immediate (atomic) environment of the protons. Small variations in the applied magnetic field accentuate spin-spin relaxation, resulting in an observed relaxation time T2* which is somewhat faster than the ‘true’ relaxation time T2 that would have been observed in an ideally homogeneous field.
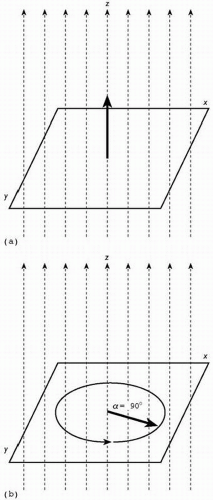 Fig. 2.3.7.1 Net magnetization vector. (a) In a static magnetic field, the vector is aligned parallel to the longitudinal z axis of the field and α = 0. (b) Immediately after a 90° excitation pulse of radio-frequency energy at Larmor frequency, the angle of alignment α is increased (transverse magnetization) and the phase of precession in the x-y plane is coherent over all protons in the brain. As protons relax following excitation, the angle of the net vector becomes smaller (return of longitudinal magnetization) and the phase of precession becomes more variable from one proton to another (dephasing). |
As protons relax, they release the energy absorbed from the radio-frequency pulse in the form of a weak radio-frequency signal, which decays at a rate normally determined by T2*. This process is called free induction decay, and the emitted signal forms the data from which magnetic resonance images are ultimately constructed.
Magnetic resonance imaging
Spin echo sequence
A widely used MRI technique is the spin echo sequence. A 90° radio-frequency pulse is repetitively applied to the brain with a constant repetition time (TR ms) between consecutive pulses. Following each 90° pulse, protons are excited and then relax. The dephasing component of relaxation can be reversed by applying a second 180° pulse some time (TE/2 ms) after the 90° pulse. Following the first 90° pulse, protons immediately begin to precess idiosyncratically and the emitted signal decays. By reversing this process, the 180° pulse causes rephasing and an increase in emitted signal which has a maximum or echo at TE ms (time to echo) after the initial 90° pulse (Fig. 2.3.7.2).
The spatial location of the radio-frequency signal emitted by free induction decay in a given volume of the brain is encoded in three spatial dimensions by slice-selective radio-frequency irradiation combined with frequency- and phase-encoding gradients. To improve scan time, multiple slices can be excited in an interleaved fashion (multislice acquisition). This means that after the output signal is detected from one slice, and while the net magnetization vector is relaxing back to its equilibrium state, other slices can be excited. The in-plane resolution (voxel size) of the image is determined by the field of view and the number of voxels in the image. Typically, in-plane resolution at 1.5 T is in the order of 0.5 to 2 mm, and slice thickness is 2 mm or more.
Tissue contrast
The outstanding advantage of MRI for the anatomical examination of the brain is the easily visible contrast in the images between grey matter, white matter, and cerebrospinal fluid. In particular, contrast between parenchymal tissues (grey and white matter) has made MRI the imaging research tool of choice for identifying subtle cortical abnormalities in a wide variety of psychiatric disorders.
Tissue contrast in magnetic resonance images is determined by differences in the density of protons, and their physical and chemical environment. A tissue such as the cerebrospinal fluid, that is
composed largely of water, will have a lower proton density than parenchymal brain tissues. The physicochemical environment of protons has a marked effect on spin-lattice relaxation. If protons are mainly in freely diffusing water molecules, as they are in cerebrospinal fluid, T1 will be prolonged, whereas if they are mainly bound to large macromolecules, as they are in fat, T1 will be short (Table 2.3.7.1). Since grey matter contains proportionally less fat than myelinated white matter, T1 is longer for grey matter. Spin-spin relaxation is likewise determined, in part, by the immediate physical environment of protons in the tissue; liquid tissues will have prolonged T2 times compared with solid tissues. Other effects on apparent relaxation times (T2*) include minute fluctuations or inhomogeneities in the strength of the external magnetic field, which may be due to the local paramagnetic effects of iron-containing compounds such as haemoglobin.
composed largely of water, will have a lower proton density than parenchymal brain tissues. The physicochemical environment of protons has a marked effect on spin-lattice relaxation. If protons are mainly in freely diffusing water molecules, as they are in cerebrospinal fluid, T1 will be prolonged, whereas if they are mainly bound to large macromolecules, as they are in fat, T1 will be short (Table 2.3.7.1). Since grey matter contains proportionally less fat than myelinated white matter, T1 is longer for grey matter. Spin-spin relaxation is likewise determined, in part, by the immediate physical environment of protons in the tissue; liquid tissues will have prolonged T2 times compared with solid tissues. Other effects on apparent relaxation times (T2*) include minute fluctuations or inhomogeneities in the strength of the external magnetic field, which may be due to the local paramagnetic effects of iron-containing compounds such as haemoglobin.
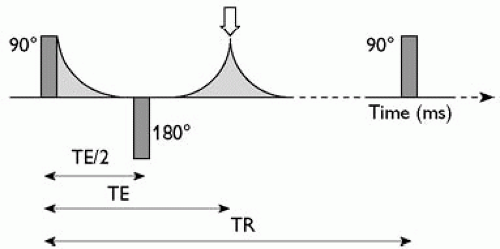 Fig. 2.3.7.2 Spin echo pulse sequence. A 90° excitation pulse of radio-frequency energy is immediately followed by exponential decay of the T2-weighted signal. A 180° pulse TE/2 ms later causes rephasing of proton spins and an exponential increase in T2-weighted signal with maximum (echo) TE ms after the 90° pulse. Images are acquired at TE (thick arrow). The protons are allowed to relax completely before the next 90° pulse, TR ms after the previous excitation. |
The parameters of the spin echo pulse sequence, repetition time (TR), and time to echo (TE), can be judiciously adjusted to acquire images that are sensitive to or weighted by one or other of these possible sources of tissue contrast.
If TR is long (>1000 ms) and TE is short (<20 ms), contrast in the images will be weighted by differences between tissues in proton density. Proton-density-weighted images show good contrast between relatively hyperintense parenchymal tissue and hypointense cerebrospinal fluid (Plate 7).
If TR is short (<1000 ms) and TE is also short (<20 ms), contrast in the images will be weighted by tissue differences in spin-lattice relaxation. T1-weighted images show excellent contrast between hyperintense white matter and relatively hypointense grey matter (Plate 7). For this reason, T1-weighted images are widely used to measure quantitative abnormalities in size or shape of the cerebral cortex.
If TR is long (>1000 ms) and TE is also long (>20 ms), contrast in the images will be weighted by tissue differences in spin-spin relaxation. T2-weighted images show strong contrast between hyperintense cerebrospinal fluid and parenchymal tissues (Plate 7), unless there is congestion or oedema of the parenchyma, in which case the T2-weighted signal will be increased. For this reason, T2-weighted images are widely used to identify acute, inflammatory, and ischaemic lesions.
Structural imaging sequences
An enormous range of sequences are available for brain imaging. For example, fast spin echo imaging provides a pair of dual-echo images with complementary tissue contrasts (proton density and T2-weighted) for no increase in scan time over the spin-echo sequence. Spins can also be manipulated through changes in the applied magnetic field gradients. These sequences yield images of high-spatial resolution and a range of contrasts. Additionally, there are methods for suppressing signals due to blood flow or fat, improving signals from pathology.
Related posts:


Stay updated, free articles. Join our Telegram channel

Full access? Get Clinical Tree


