Fig. 1
Real experimental scene of watching 3D images
2.3 Math
We chose the Classical Power Spectral Density Estimation to analyze the signals collected. On the MATLAB 2010b platform, we used the periodogram function to calculate the mean power spectrum. Then, we calculated the percentages of each band in the total power spectrum and fitted straight lines to search the trends totally. Finally, both the power spectrum data and percentages are analyzed using ANOVA (a repeated measures analysis of variance) on SPSS 18.0 platform.
3 Result
We set the EEG in terms of four frequency bands including delta (1–4 Hz), theta (4–8 Hz), alpha (8–13 Hz), beta (13–30 Hz). Each band’s power spectrum was analyzed. From the analysis, the subjects’ discomfort was obvious during the 50–60 min, as shown in Figs. 2, 3, and 4.


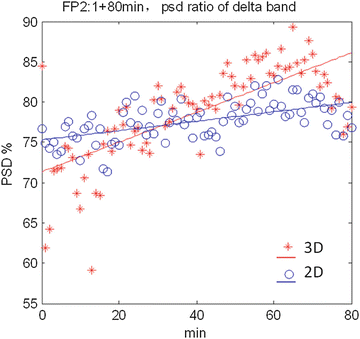
Fig. 2
Average of PSD ratio of delta band in FP2 lead

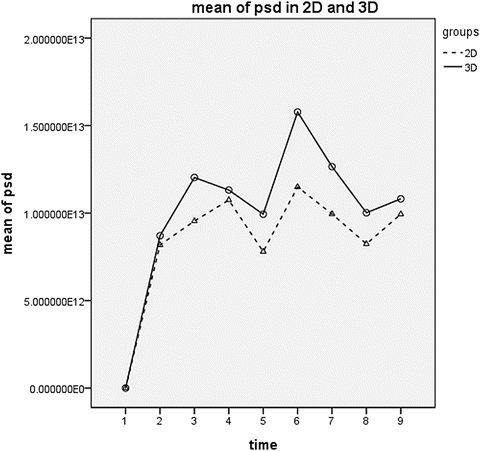
Fig. 3
Average power spectra of delta band in Oz lead, EEG signals were recorded during watching 2D image and 3D image respectively

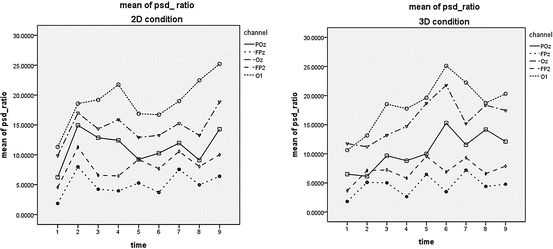
Fig. 4
Power spectra ratio of gamma band, EEG signals were recorded from two groups watching 2D image and 3D image respectively
In Fig. 2, the PSD ratio of delta band in 3D condition (red line) ascends more obviously than 2D condition (blue line). Since delta band denotes the excessive fatigue and lethargy [8], the result concluded that the 3D condition could cause more obvious discomfort in frontal region.
In Fig. 3, we segmented the viewing EEG for every 10 min and calculated the mean power spectrum. Then, the analysis of variance of repeated measure was used on the SPSS 18.0 platform. The points in horizontal axis (time) 1, 2, 3, 4, 5, 6, 7, 8, 9 represent 0, 10, 20, 30, 40, 50, 60, 70, 80 min respectively. In comparison, the accelerating rate in 3D condition was more than 2D condition with the alpha band data in Oz channel. Also, there is significant difference between the two conditions (p < 0.05).
As shown in Fig. 4, the trends of the channels FPz and FP2 in frontal area are consistent in 2D and 3D condition. Also, the channels POz, Oz, and O1 in occipital area are consistent in two conditions, and the changes in 3D condition was more obvious than 2D condition, both of which maximized after 50 min.
Stay updated, free articles. Join our Telegram channel

Full access? Get Clinical Tree


