Fig. 1
Different spiking frequencies with the changing of g Nap and g Ks . (a) g Nap = 150 μS/cm 2, g Ks = 1.1 μS/cm 2, (b) g Nap = 100 μS/cm 2, g Ks = 0.7 μS/cm 2, (c) g Nap = 50 μS/cm 2, g Ks = 0.5 μS/cm 2, (d) g Nap = 20 μS/cm 2, g Ks = 0.3 μS/cm 2
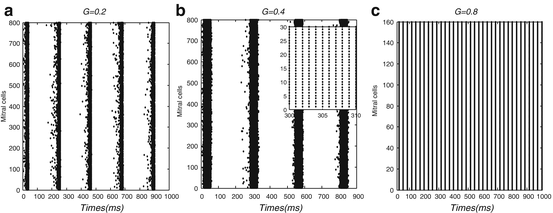
Then we use this olfactory model to simulate a sparse network of 800 spiking cortical neurons with 800 × 799 synaptic connections. Spatiotemporal patterns of all neurons with synaptic coupling in the complex networks are displayed in Fig. 2. We simulate a network of globally connected 800 neurons in real time, whose coupling strengths are chosen as different values. The coupled neurons were found located in different states. The synaptic connection weights between the neurons are given by the matrix G = (g i, j ), so that firing of the jth neuron instantaneously changes variable V i by g i, j . In the Fig. 2a–c, neurons at different synaptic coupling weights G = (g i, j ) are considered. At first, G = 0.2 is taken, that is, all g i, j are taken the same as 0.2. It is shown that the neurons organize into assemblies and exhibit collective rhythmic behavior. With the coupling weights increasing, we find the width of the assemblies is becoming larger (Fig. 2b), the coupled neurons could achieve local synchronization inside the assemblies as showed in the enlarged picture of Fig. 2b. When the coupling weights is added to G = 0.8, the coupled neurons eventually achieve synchronization as shown in Fig. 2c. It is evident that the synaptic coupling weight is increased and the synchronous action between neurons is strengthened.


