Fig. 1
(a) Nine copies of Epo HRE consensus sequence. The HIF-1 binding sites are underlined. (b) Schematic drawing of H9LacZ and H9VEGF. Nine copies of Epo HRE (9HRE) were cloned in front of the minimum SV40 promoter (PmSV40). H9VEGF was generated by replacing the LacZ sequence between Hind III and Nde I with human VEGF165 cDNA
3.2 pMCAO Model
1.
This protocol is approved by the Animal Care Committee of the University of California, San Francisco.
2.
Anesthetize adult mouse using 5 % isoflurane inhalation, maintaining at 1 ~ 1.5 % isoflurane during the whole procedure.
3.
Place the mouse at a posture on a heating pad to maintain the head and body temperature around 37 ± 0.5 °C throughout the entire surgical procedure.
4.
Make a vertical skin incision long enough to gain access to the zygomatic arch between the left external auditory canal and orbit.
5.
Deflect the temporal muscle anteriorly.
6.
Remove the middle part of the left zygomatic arch without damaging the mandibular nerve.
7.
Retract muscles both downward and anteriorly.
8.
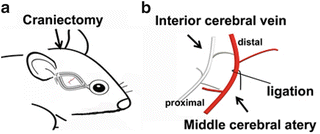
Make a 4-ram craniectomy just anterior and superior to the foramen ovale using a microdrill with 0.35- ~ 0.42-mm diameter ultrafine burrs (Fig. 2a).


Fig. 2
Schematic illustrations of craniectomy position and middle cerebral artery. (a) Schematic illustration shows the position of the craniotomy after removal of the skin and muscle. (b) Schematic drawing of MCA and ligation site: the left MCA is exposed and occluded. In order to make the infarct at the same location and comparable size among the animals, the MCA should be occluded at the same site in all the experimental animals
9.
Peel the bone off using blunted no. 1 forceps.
10.
11.
Close the incision site with surgical 6-0 monofilament nylon sutures.
12.
Measure surface blood flow before and after the occlusion using a Laser Doppler Flowmeter (Vasamedics, St Paul, MN, USA) of the artery to make sure the blood flow drops to below 20 % of baseline after the occlusion of the artery.
3.3 Intravenous Injection of AAV Vectors (See Note 4)
3.3.1 Tail Vein Injection (Fig. 3a, See Note 5)

Fig. 3
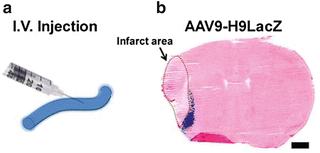
Schematic illustrations of IV injection and LacZ gene expression mediated by IV-injected AAV9-H9 vector. (a) AAV vector is IV-delivered. (b) Infarct area is circled in brown dots. LacZ gene expression (blue color) is exclusively in the peri-ischemic region. Scale bar: 1 mm
1.
Warm the tail by immersing it in warm water or using a heating pad or placing the animal under a heat lamp.
2.
Inject the vectors using 26-gauge needle, and finish the injection of 100 μl viral vectors in 15 s.
3.3.2 Jugular Vein Injection
1.
Anesthetize mouse using 5 % isoflurane inhalation, maintaining at 1 ~ 1.5 % isoflurane during the whole procedure.
2.
Put the mouse in a supine position. Shave the fur on the front neck and disinfect the skin.
3.
Make a 1–1.5 cm incision between the chin and the sternum on the right side.
4.
Expose the external jugular vein and a part of the pectoral muscle (anterior margin of the pectoral muscle is marked by the disappearance of the external jugular vein beneath it).
5.
Place the needle into the vein through the pectoral muscle with the bevel facing toward you.
6.
Inject AAV vectors (2 × 10¹¹ gcs) in 200 μl in PBS using syringe with 26-gauge needle.
7.
Close the wound with sutures after the injection.
3.4 Behavioral Tests (See Note 6)
3.4.1 Corner Test
Mice are placed between two boards with identical dimensions (30 × 20 cm). When mice are near the corner, both sides of their vibrissae will be stimulated. They will rear forward and upward and then turn back to face the open end. Normal mice will turn to the left or right side with equal frequency, whereas stroke mice will turn more often to the ipsilateral side of the lesion (left). The percentage of left turns is recorded in three different sets of ten trials. Turning movements not incorporated in a rearing movement are not recorded.
3.4.2 Adhesive Removal Test
Adhesive tape (0.3 × 0.3 cm) is applied on each paw. The time it takes for the mice to remove the tape from each paw is recorded with a maximum testing time of 120 s. Mice will be trained three times daily for 4 days before the surgery to obtain an optimal level of performance.
3.5 Tissue Stains and Morphometry
3.5.1 Assay Transgene Expression (X-gal Staining, Fig. 3b)
1.
Cut 20 μm coronal sections of the brain and fix in 0.5 % glutaraldehyde for 10 min.
2.
Incubate the sections in X-gal staining solution for 2 h and photograph.
3.
Calculate the transduction volumes by multiplying the transduction areas by the thickness of the sections using NIH ImageJ 1.63 software.
3.5.2 Assay Infarct/Atrophic Volume (Cresyl Violet Staining)
1.
Cut brain into 20 μm serial sections.
2.
Fix one of every 10 s in 4 % paraformaldehyde solution.
3.
Incubate the sections in cresyl violet solution for 5–10 min.
4.
Differentiate sections in 70, 90, and 100 % ethanol sequentially, for 2 × 3 min each. Incubation time can vary slightly according to staining density and section thickness.
5.
Transfer sections to xylene for 2 × 5 min each.
6.
Mount sections with Permount.
7.
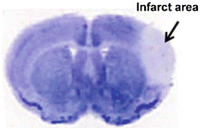
Outline the infarct/atrophic (pear blue) and the ipsilateral hemisphere areas using ImageJ software (Fig. 4).


Fig. 4
Nissl staining illustrates the infarct area in the pMCAO model. The infarcted brain (arrow) is lighter than the normal brain
4 Notes
1.
Nine copies of Epo HRE and a minimum SV40 promoter can mediate efficient hypoxia-inducible gene expression in the ischemic heart [26] and brain tumor cell lines [65]. Other investigators have induced hypoxia-responsive gene expression in the heart and other tissues by using four copies of Epo HRE and a minimum SV40 promoter [66]. HRE can also be used in combination with CMV minimum promoter to induce hypoxia-responsive gene expression [67]. Cardiac-specific promoters can be used in combination with HRE to mediate cardiac-specific and hypoxia-responsive gene expression.
2.
The AAV Helper-Free Gene Delivery and Expression System is generated based on AAV serotype 2 virus. Many new AAV serotypes have been cloned in recent years [68–73]. Recombinant cross-packaging of AAV genome of one serotype into other AAV serotypes to achieve optimal tissue-specific gene transduction is now possible. The AAV packaged in serotypes other than 2 can be made by replacing the serotype 2 CAP sequence in pAAV-RC with the CAP sequence of the corresponding serotype.
3.
Drilling or electrocoagulation may lead to thermal and mechanical damage of the brain. Exposure of intracranial contents to the atmosphere should be minimized to avoid additional brain damage.
4.
No more than 1 % of the mouse’s body weight in volume should be injected at a single time. For example, no more than 0.2 mL of fluid should be injected in a 20-g mouse.
5.
To improve the visibility and the success of the injection, the mouse can be warmed for 5–10 min using either a heating pad or a heat lamp to dilate the tail vein. If using a heat lamp, monitor the mouse at all times to avoid hyperthermia. During the injection, if the needle is properly placed in the vein, it should move freely and without pressure. If a blister appears on the tail, stop injecting, as this indicates that the needle is no longer in the vein.
6.
7.
At the early stage of ischemic injury, the ipsilateral hemisphere has edema, which will influence the volume measurement. By the latter stage of pMCAO, the infarcted tissue has undergone atrophy, which will cause an underestimation of the volume of injury. To minimize the influence of edema and atrophy, the infarct/atrophic area can be calculated by subtracting the normal area of the ischemic hemisphere from the area of the nonischemic hemisphere. The infarct/atrophic volume is reconstructed using serial sections [5, 76].
References
2.
3.
4.
5.
6.
Zeng L, He X, Wang Y et al (2014) MicroRNA-210 overexpression induces angiogenesis and neurogenesis in the normal adult mouse brain. Gene Ther 21:37–43PubMedCrossRef
Stay updated, free articles. Join our Telegram channel

Full access? Get Clinical Tree


