Fig. 1.1
Breastfeeding and general intelligence: mediation and moderation
From this pattern of “transactions”, we conclude that exposure (breastfeeding) affects the outcome (general intelligence) by influencing mediator 1 (brain growth inferred from head circumference) and mediator 2 (white matter), with one moderator (genotype) influencing the impact of exposure on mediator 2. This conclusion is reached after ruling out the possible role of two confounders (maternal education, height). Importantly, the moderating effect of the genotype hints at a possible mechanism underlying the relationship between breastfeeding and general intelligence: the role of fatty acids in the development of white matter.
In summary, observational epidemiology represents the first step in our quest to explain sources of inter-individual variability: it reveals novel associations between external exposures and outcomes and, through statistical means, sorts out possible mediating, moderating and confounding influences of other variables on the outcome. If we add information about the individual’s genes, the shift from classical observational epidemiology to molecular epidemiology begins (see Sect. 2.1).
1.2 Genetics: Genome, Epigenome, Transcriptome and Proteome
The nucleus of each cell in the human body contains 23 pairs2 of chromosomes made up of bundles of deoxyribonucleic acid (DNA) and proteins (histones), which allow DNA to be packaged into chromatin (a combination of DNA and histones). The human genome is coded by the sequence of nucleotides (adenosine, guanine, cytosine and thymine): A, G, C and T comprise the alphabet of the genetic code.
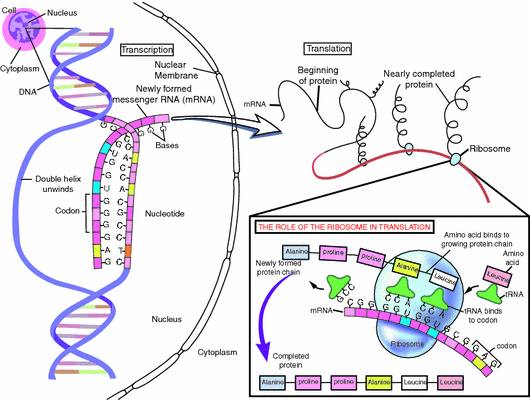
Genes (~20,000 of them) are the units of inheritance. Each gene consists of two alleles, of one DNA strand each: one inherited from the mother and another from the father. Genes are “expressed” when DNA is transcribed into a messenger RNA (mRNA), which leaves the nucleus and is translated into proteins on ribosomes (Fig. 1.2). Gene expression is regulated by a multitude of factors. Perhaps surprisingly, external exposures (e.g. diet, stress) may also affect gene expression via so-called epigenetic modifications. Such epigenetic modifications will often “switch off” a gene for the rest of a person’s life.


Fig. 1.2
From gene to protein. © 2001 Terese Winslow
The genome is the map of genetic variations across all chromosomes. In a given individual, these variations—for example, in a single-nucleotide polymorphism (A or G)—are the same in all of his/her cells (and tissues). On the other hand, the epigenome is the map of epigenetic variations (methylations, acetylations) found in the DNA of cells in specific tissues. Thus, the epigenome of brain cells will not be the same as that of liver cells. This is important for population-based studies: while genetic variations observed in DNA extracted from blood cells (the most readily available biospecimen in human studies) are the same for all tissues, epigenetic variations observed in blood cells may or may not be the same as those we could find in, say, brain cells (which we cannot access in our living participants, for obvious reasons).
The same is true about the transcriptome and proteome; each cell type (and tissue) will have its own “map” of gene expression (transcriptome) and proteins (proteome) synthesized in that tissue. Furthermore, transcriptomes and proteomes are dynamic: when quantified, the mRNA and protein levels of a given gene will depend on a variety of factors, such as the time of day or stress level at the time of tissue removal.
As you can see, we can conceptualize variables derived from a genome as “independent” variables (exposures or moderators), while those derived from a transcriptome and a proteome are best thought of as “dependent” variables (outcomes or mediators). Similarly, the methylation status of a gene can be used as an outcome of an external exposure (e.g. stress) or a mediator of the effect of stress on the expression of this gene.
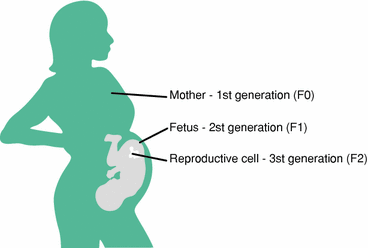
Before we leave this section, let us touch on the origin of inter-individual variations in our genome and epigenome. In the case of genes, these variations emerge through two basic processes: (1) recombination during sexual reproduction and (2) de novo mutation in germ-line cells (oocytes and spermatocytes). Note that mutations occurring in the DNA of well-differentiated cells (in specific tissues, such as the brain or liver) cannot be passed onto the next generation. Similarly, epigenetic modifications of the DNA in germ-line cells can be passed onto the next generation, but those affecting specific tissue cannot. Thus, epigenetic inheritance is a vehicle for trans-generational transmission of environmental influences. In other words, the expression of a granddaughter’s genes might in some case reflect her grandmother’s lifetime exposure (Fig. 1.3).


Fig. 1.3
The Russian doll of trans-generational epigenetics. Three generations at once are exposed to the some environmental conditions (e.g. diet, toxics, hormones). From Perera and Herbstman (2011)
Altogether, the “mappers” of the genome (genomics), epigenome (epigenomics), transcriptome (transcriptomics) and proteome (proteomics) provide us with a wealth of information about inter-individual variations in the molecules involved in processes that lead to a particular state of brain structure and function. Transcriptomics and proteomics, together with metabolomics and lipidomics, yield molecular phenotypes (see Chap. 6). Genomics reveals inter-individual variations in the pattern of nucleotides across our genome, such as single-nucleotide polymorphisms and copy number variations (see Chap. 4). And epigenomics opens up new avenues for exploring de novo, as well as heritable, environment-induced modifications of DNA, which affect gene expressions rather than the genetic code (see Chap. 5).
1.3 Cognitive Neuroscience: Specialization, Connectivity, Development and Plasticity
Population neuroscience is concerned with explaining the sources of inter-individual variations in the structural and functional properties of the human brain and, by extension, behaviour. In large studies, these properties can be most readily measured with structural and functional magnetic resonance imaging (MRI), together with cognitive and mental health assessments. These “system-level” phenotypes are described in detail in Chap. 7. Here, we will touch upon basic facts about the human brain, its organization, development and plasticity.
The human brain is an organ capable of a multitude of functions. It can see and hear, move and think, suffer and enjoy. It appears to function as a mosaic of highly specialized “modules” located in spatially distinct brain regions, which are interconnected to form neural networks. In these networks, information is computed in nodes (or modules) specialized in extracting particular features of the “reality”, such as the speed, shape and colour of a moving object. To form a representation of the “reality”, this information is shared across the nodes, new information is derived based on the combination of the individual features, an object is named (“apple”) and finally an appropriate plan of action is formed and executed (“catch the apple”).
The main phenotyping tool—brain mapping—operates in the three-dimensional space of this 1,300 cm3 organ. It is therefore important to keep oriented in this maze of cells, tissues and locations.
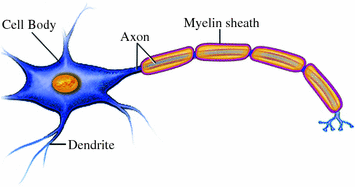
Based on the appearance of the brain tissue to the naked eye, we can distinguish grey matter (~55 % of brain tissue) and white matter (~45 %). Grey matter consists of neuronal cell bodies and their short extensions (or processes) called dendrites. White matter is occupied mostly by the long processes called axons, which carry electrical signals from the cell body to the synapse (Fig. 1.4). The white matter owes its appearance to the high concentration of myelin, a fatty substance wrapped around and insulating the axons, thereby speeding up the conduction of electrical signals.


Fig. 1.4
Neuron
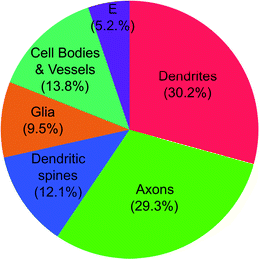
Interspersed between the neurons are glial3 cells: astrocytes (important for metabolism and recycling of neurotransmitters), microglia (performing immune functions) and oligodendrocytes (producers of myelin in the brain). Also found between the neurons are, of course, blood vessels and neuropil—the latter containing small neuronal and glial extensions (Peters et al. 1976)—as well as the fluid of extracellular space. Not surprisingly, one cubic millimetre of cortical tissue contains a mix of different cells (Fig. 1.5). We need to keep this in mind when interpreting brain phenotypes obtained with MRI.


Fig. 1.5


The relative volumetric contribution of various cellular compartments in one cubic millimeter of mouse cerebral cortex. E, extracellular space. Data from Braitenberg (2001). From Paus (2009)
Stay updated, free articles. Join our Telegram channel

Full access? Get Clinical Tree


