Figure 10.1. Insonation bone windows through which the arteries giving rise to the circle of Willis and its major branches can be studied: transforaminal, transtemporal and transorbital insonation windows.
Spencer and Reid used and popularized the Doppler effect to obtain information from the circulation in different blood vessels using ultrasound. Cerebral circulation was not possible to assess at an earlier stage because it was interpreted that the ultrasound could not pass through the skull. In 1982, Aaslid and colleagues introduced transcranial Doppler (TCD) in clinical practice to evaluate cerebral hemodynamics using ultrasound waves of 2 MHz, the smallest frequency used in medicine to that date. They were able to show that it is possible to measure the velocity and direction of cerebral blood flow (CBF) in several intracranial blood vessels through an intact skull and noninvasively [2-4]:
- The proximal segments of the arteries which make up the circle of Willis.
- The arteries that give rise to them (carotids and vertebral arteries).
- Their major branches.
- The major cerebral veins and venous sinuses.
IThe vessels that can be studied with TCD are:
- Proximal segments of the arteries making up the circle of Willlis.
- The arteries that gives them rise(carotids and vertebral arteries).
- Their major branches.
- It also allows blood flow circulation at major cerebral veins and venous sinuses to be assessed.
In experienced hands, this tool provides considerable amount of information in “real time” (excellent temporal resolution). It is also fast, simple, non-invasive, reproducible and feasible to perform at the bedside as often as the patient condition requires it, or even in a continuous way. All these features make the technique extremely valuable in the critical care setting. It is the only non-invasive technology available today that allows neurointensive care physicians or neuro-emergencists to monitor the intracranial hemodynamic characteristics at the patient´s bedside, without transfers (avoiding associated risks), in real time, noninvasively, through the intact skull. In this way the functional/dynamic information provided by this technique complements very well the static data provided by a CT or MRI.
What variable does TCD measure? As anticipated above, TCD measures Cerebral Blood Flow Velocity (FV) and its direction in the large basal cerebral arteries (Willis circle and main branches). In order to simplify the evaluation of FV a “spectral envelope” corresponding to the maximum flow velocity throughout the pulse cycle is created. Three specific points can be recognized in this envelope: peak systolic, end diastolic and mean flow velocity. The relationships between these velocities define indices (pulsatility and resistance index). Mean flow velocities and their relationships with velocities obtained from respective extra-cranial segments of carotid and vertebral arteries define different cerebral hemodynamic patterns. More information about ultrasound physics and specific characteristics of the technique are attached at the end of the chapter (see Appendix).
It is essential to note that FV as measured by TCD, is not synonymous with cerebral blood flow (CBF). CBF represents a flow (in mL/sec, and FV represents a velocity, in cm/sec. Although absolute values of CBF cannot be measured with TCD, changes in FV during continuous monitoring reflect proportional changes in CBF. This means that during continuous monitoring, if FV doubles, CBF has doubled, if the FV decreases by half means that the CBF has halved. However, we cannot know the absolute numeric value of these flows. When studying cerebral hemodynamics in critically ill patients, it is important to assess the results in light of the systemic hemodynamics (arterial pressure), the presence of drugs (sedation, analgesics, vasopressors) or pathophysiological changes which act on the cerebral circulation (temperature, hemoglobin). It is also desirable to perform multiple neuromonitoring. This allows the simultaneous assessment of several variables. The parameters thus obtained allow a deeper evaluation of existing alterations. Other –invasive- variables which complement the information provided by TCD ultrasonography are ICP, cerebral oxygenation (global, by JSO2, and local, by PtiO2), continuous or intermittent EEG, etc.
10.2 Flow Velocity and Pulsatility Index. Normal Range and its Variations
Normal flow velocities vary in different vessels. In addition, they vary with age, systemic and/or cerebral hemodynamics, physicochemical characteristics of blood (viscosity), etc. FV oscillates between 30 and 80 cm/s, approximately. For example, in the adult group, FV in the middle cerebral artery (MCA) is 58±12 cm/s. FV in the basilar artery is 36±12 cm/s.
Side to side (right to left) variations has been detected in normal individuals, but differences above 15% should not be interpreted as normal. A daily variation is also possible but should be assumed as normal only if it is lower than 10 cm/s.
Increase in velocity | Decrease in velocity |
|
|
Table 10.1. Factors causing an increase or a decrease in CBFV.
10.3 Clinical Applications of Transcranial Doppler in Intensive Care Medicine
TCD is an important non-invasive diagnostic tool in evaluating patients with cerebrovascular disease. In Intensive Care its use is particularly aimed to detection and monitoring of changes in cerebral hemodynamic in subarachnoid hemorrhage (SAH), ischemic and hemorrhagic stroke, traumatic brain injury (TBI) and other diseases not so frequent but equally serious, such as meningitis and encephalitis, severe vasculitis, etc. The most frequent disturbances of cerebral hemodynamic in these patients are secondary to increased intracranial pressure and the possible development of cerebral circulatory arrest (CCA), cerebral vasospasm, hyperemia, and impaired cerebrovascular reactivity (autoregulation and CO2 reactivity). In the intensive care unit there are many technical difficulties, related to: 1) the multiple monitoring systems which surround the patients, with wires and catheters, respirators; 2) the difficulties of positioning non collaborating patients. The fundamental interest in the neurocritical care patient is often to evaluate the alterations of cerebral hemodynamic globally, or to search for assimetries. To diagnose these alterations it is enough to insonate middle cerebral arteries bilaterally, and the basilar artery in the posterior sector. However, if the main interest is the study of a localized disturbance, such as vasospasm, the evaluation should be detailed along each vessel.
TCD has a broad spectrum of clinical applications. In neurocritical patients, its major applications are:
- To confirm or exclude the existence of intracranial hypertension (ICH) in many clinical scenarios, assisting in the decision making process on the indication of invasive monitoring of ICP [5-14].
- To diagnose cerebral circulatory arrest (CCA) [15-21] (with very high specificity), avoiding invasive procedures or transfers, thus helping in the diagnosis of brain death.
- To help in the diagnosis and monitoring of cerebral vasospasm. Vasospasm is one of the main SAH neurological complications and appears quite frequently in the course of this disease, but is also important to remember that vasospasm has been demonstrated in the evolution of TBI and CNS infections [26-30].
- In the stroke patient, the TCD can provide immediate information about the status of cerebral hemodynamics, evidence if there is vascular stenosis (partial occlusion) or complete occlusion, can monitor the time course of recanalization when performing thrombolytics, and even enhance the action of these drugs. In addition it can provide information regarding the pathophysiological mechanism of stroke, such as the existence of microemboli and detect the presence of right-left shunt in cryptogenic stroke. Finally, it is also possible to evaluate the cerebral circulatory reserve and the status of cerebral autoregulation, thus helping the clinician in the management, monitoring of treatment and prognostic assessment.
In the ICU is common that many of the variables which are able to influence the intracranial hemodynamic are altered, so that the probable influence on the founded FV should be taken into account. But the most important factor, given its hazard, which should always be thought as a cause of a low FV is the rise in intracranial pressure.
10.3.1 Pulsatility Index and Resistance Index
From the FV waveform systolic, diastolic and mean velocities can be calculated. Analysing the relationship of these velocities various indices of cerebrovascular resistance can be calculated. Pulsatility index (PI) and resistance index (RI) are widely used and complement the characterization of sonographic patterns.
The IP is calculated using the following formula:
PI = (FVs – FVd) / FVm
TCD ultrasound software usually calculates PI and time-averaged mean velocities for each sonogram and displays them on the screen.
RI is calculated using the following formula:
RI = (FVs – FVd) / FVs
These indices are very helpful when assessing a particular patient, especially in intensive care medicine. Intracranial hypertension slows the flow velocity, preventing the normal flow of blood through the cerebral vascular bed. Velocities are affected and decrease mainly in diastole, which is the period of the cardiac cycle in which blood enters into the brain circuit with less power. This leads to a relatively greater increase in the FVs (FVs – FVd) and explains that the PI or RI indices increase when ICP is going up. There are other factors able to descend the FV in the absence of intracranial hypertension, which are factors that act directly on the arteriolar resistance (diameter). Therefore, when either of these two indices is above the normal value the physician should act promptly searching for the presence of any factor that could be affecting the normal blood flow circulation, such as:
- Intracranial hypertension leading to a decrease in the cerebral perfusion pressure (CPP).
- Increased cerebrovascular resistance from another source, such as the presence of a cerebral circulation vasoconstrictor (ie, hypocapnia, indomethacin).
- Bradycardia. In this situation, the time between heartbeats is greater, so that the diastolic velocity decreases for a longer period, until it reaches the new wave pulse, increasing the velocity-gap (FVs – FVd).
- Vascular stiffness (rigidity); in the absence of energy absorption by the arterial wall, the FVs goes up while the FVd goes down.
The most widely used of the two indices is the PI. Its normal value varies between 0.60 and 1.20. Although the normal maximum value is 1.20, clinically is reasonable to suspect the presence of significant intracranial pressure increase and seek their cause when the index is above 1.00. The PI findings during the acute phase of TBI have been correlated with the prognosis. An increase in PI, mainly when is associated with a decrease in FVd, indicates a poor CPP. Several clinical studies in adults and children who have suffered head injury (different degrees of severity) have shown worse outcomes associated with low flow velocities (less than 25 cm/s in children) and raised PI (above 1.3 or 1.5) [34-36].
The pathological process triggered by the acute and severe CNS disease can affect the cerebral circulation in many and complex different ways. Under certain conditions specific changes prevail. For example, vasospasm is known as a frequent complication of SAH, but that does not mean that there is no vasospasm in other neurological diseases, or that vasospasm is the only cerebral hemodynamic complication of SAH. On the other hand, different alterations often coexist and the physician should have them in mind, knowing that in many circumstances different alterations act in an opposite directions leading to a ¨pseudonormal ultrasound pattern¨ (also called mixed pattern).
Doppler pathological patterns are not related to specific diseases, but to its pathophysiological impact on cerebral circulation. Therefore, the impact of the most frequent alterations: intracranial hypertension and vasospasm, on FV and PI will be first described. Finally, some reference to different acute neurological conditions (SAH, TBI, stroke) will be added, with a schematic analysis of the hemodynamic changes that may be encountered during their course.
10.4 Transcranial Ultrasonographic Abnormalities in Neurocritical Patients
TCD ultrasonography provides valuable information about the effect on cerebral circulation of the pathophysiological changes produced by neurological injuries. It detects abnormal modifications consistent with increased intracranial pressure, cerebral circulatory arrest, vasospasm, hyperemia and impaired cerebrovascular reactivity.
The different patterns to be analyzed are:
- High-velocity pattern.
- Low-velocity pattern.
- High-resistance pattern.
- Cerebral Circulatory Arrest (CCA) pattern.
10.4.1 High-velocity Patterns
Both hyperemia and vasospasm are evident in TCD sonogram as an increase in flow velocity.
Vasospasm Vasospasm of cerebral arteries may be focal or diffuse. Its first hemodynamic consequence is a decrease in the pressure loss through the stenotic segment. If the cerebrovascular autoregulatory mechanism works, local CBF can be maintained at the expense of a dilatation of distal small autoregulatory vessels. The same amount of blood (per unit time) passes through an arterial segment whose lumen has fallen. Therefore, the blood must pass more rapidly (compensatory response). This velocity augmentation occurs, therefore, in the stenotic segment. If we measure CBF rather than flow velocity, we would find it preserved if autoregulation is working properly, or decreased if autoregulation is defective/impaired or if it is maintained but not enough to compensate a very severe spasm. It must be emphasized that in the case of vasospasm, CBF is not increased.
Hyperemia. In this case CBF is increased, regardless of whether the cause is (greater brain metabolic demand or ¨luxury perfusion¨), more blood than in normal conditions is passing through a normal/increased vessel calibre. Therefore, it circulates faster.
High Velocity Differential Diagnosis
As it has been mentioned before, an increased FV may correspond to vasospasm or hyperemia. Is it possible to distinguish them? Lindegaard [37] proposed to study the relationship between the FV in the intracranial affected vessel and the velocity in the extracranial vessel supplying blood to it. As vasospasm is an alteration of the intracranial arteries which have been in contact with subrachnoid blood, flow velocity increases in the compromised intracranial artery, but not in the extracranial one, therefore the rate between the two velocities increases. On the other hand, if the velocity increase is due to hyperemia, the increase in FV is seen in both, the intracranial and extracranial vessels. Therefore, the relationship between these velocities remains normal. These concepts are the basis of Soustiel [38] and Lindegaard indexes, for the anterior and posterior sectors, respectively.
Anterior circulation: Mean FV in the middle cerebral artery (MCA FVm) is compared with the corresponding value in the ipsilateral extracranial internal carotid artery (ICA) at the entrance of the skull base (ICA FVm). This relationship MCA / ICA is known as Lindegaard Index (LI), or hemispheric index. An LI >3 indicates vasospasm and if >6 severe vasospasm. Values <2 (normal) indicate hyperemia.
Posterior circulation: FV in the basilar artery (BA) is compared with corresponding value in the extracranial vertebral arteries (EVA) that supplies it, known as BA / EVA index or Soustiel index. The cut-off value is 2.
Time Course of Vasospasm and CBFV-related Changes
Vasospasm, which occurs in several pathological conditions (SAH, TEC, meningitis, etc.), is an abnormal and dynamic process. In SAH it begins around the 4th day after bleeding, has a maximum between the 7th and 10th day, and disappears around the end of the third week after the bleeding. It may progress to a mild degree and then improve, or increase to a point where regional cerebral autoregulation cannot compensate for the decrease in regional perfusion pressure, and consequently CBF decreases in the area irrigated by the affected artery eventually resulting in clinical signs of ischemia, depending on the extent, topography and collateral circulation. During the phase in which CBF is maintained, vessel lumen reduction is accompanied by a compensatory increase in flow velocity (see appendix). When vasospasm further increases, flow starts to decrease due to the inability of the regional autoregulatory mechanism to compensate for the higher drop in regional CPP. This point is known as critical vasospasm. High velocity starts to decrease (could be interpreted as improving vasospasm) and in some cases flow ceases. It is important to note here the importance of performing a daily monitoring of these patients, since at this stage a normal flow velocity (in just one study) should not be interpreted as vasospasm absence. At this stage, a third factor also plays a crucial role: blood flow through the narrowed vessel. Additionally, it should be noticed that the rise of the arterial blood pressure in a patient whose regional perfusion pressure has decreased below the lower limit of autoregulation may increase flow through the stenotic segment, increasing FV again. This increase does not signify a worsening but an improvement of the situation. In summary, not always an initial FV decrease has to be interpreted as an indicator of vasospasm improvement, nor an increase in CBF as vasospasm worsening, but the values must be interpreted in light of the clinical and therapeutic maneuvers, taking always into account the values of patient’s arterial blood pressure, and ICP-CPP if available [39].
TCD in Subarachnoid Hemorrhage
TCD is widely used for screening and monitoring vasospasm in SAH due to its simplicity, lack of invasiveness and the possibility of being performed at bedside. In patients with good clinical grade, the usefulness of TCD is most often the diagnosis and follow-up of cerebral arteries vasospasm. This technique has an excellent diagnostic specificity and an acceptable sensitivity for cerebral vasospasm. It allows an early diagnosis before clinical neurological deficit occurs. This study should be performed daily (or every two days) during the first week (after bleeding) to be able to demonstrate vasospasm onset and monitor its progress and clinical impact. As it has been previously mentioned, the typical diagnostic vasospasm pattern is characterized by an increased cerebral blood flow velocity (FV). This increase begins between days 3 and 10, reaches its maximum between days 11 and 20, and finally returns to normal within 4 weeks [40].
Many studies in SAH patients have found diagnostic velocities at different arteries.
Middle Cerebral Artery (MCA)
Aaslid and colleagues initially described three degrees of vasospasm in SAH: mild, moderate and severe with velocity limits of 120 and 200 cm/s. At the same time he emphasized Lindegaard index as an essential complement of these values. LI limits described by this author were 3 and 6 to distinguish between the three grades of vasospasm [41].
According to Vora et al., FV greater than 200 cm/s is an index of severe vasospasm, and FV lower than 120 cm/s is an index of mild vasospasm, or absence of vasospasm [19,42].
Another related study investigated velocity values associated with angiographic or clinical vasospasm, finding a threshold of 100 cm/s when angiographic vasospasm was evident (sensitivity and specificity of 1.00 and 0.75 respectively), and of 160 cm/s when clinical vasospasm was detected (sensitivity and specificity of 100%) [43].
Other studies have evaluated the percentage of velocity change comparing to a control TCD assessment (ICU admission) [44].
Other Vessels Insonated Through the Temporal Window
Anterior cerebral artery (ACA) and posterior cerebral artery (PCA): considering as a cut-off value 110 cm/s for the PCA and 130 cm/s for the ACA, specificity is very good (93% and 100%, respectively). However, the sensitivity, due to a number of anatomical and technical factors, is not reliable. This means that if TCD results are normal vasospasm can not be excluded. Since often ACA vasospasm does not associate MCA compromise, especially after an anterior communicating aneurysm rupture, great caution should be given to make treatment decisions based only on a negative test for vasospasm diagnosis [45].
Other Vessels Insonated Through the Posterior Window
In this sector FV ≥ 60 cm/s is indicative of vasospasm in both arteries (vertebral and basilar), with low sensitivity and high specificity for the vertebral artery [46]. For the basilar artery, a value of 85 cm/s has 90% specificity and 50% sensitivity. When considering a limit of 80 cm/s for the diagnosis of vertebral artery vasospasm and 95 cm/s for the basilar artery, the specificity and positive predictive value goes up to 100% [47,48].
It is important to remember that in SAH patients very often multiple changes in cerebral hemodynamic coexist (including vasospasm), mainly in those with greater clinical severity (poor grade SAH). Intracranial hypertension, frequently associated with hydrocephalus or brain swelling, vasospasm, hyperemia triggered by non-convulsive epileptic activity or impaired cerebral autoregulation, systemic disorders (spontaneous or generated by our treatment) like fever, sepsis, hyponatremia, anemia, hypercapnia, hypocapnia, hypovolemia, hypervolemia, hypertension, hypoxemia. All these variables may cause intracranial hemodynamic changes and make TCD interpretation a real challenge for doctors.
For example, the frequent association between a) vasospasm (typically increases FV and reduces the PI) and b) intracranial hypertension (decreases FV and increases PI) results in a tricky “pseudo normal pattern”. It is also common that these patients have severe systemic complications, including sepsis, which may be accompanied by an hyper-dynamic state with cerebral hyperemia. Hence, it is crucial to use the mentioned indices (PI and/or RI) in order to be able to detect how greatly all these systemic disturbances are affecting (or not) the TCD pattern. These indices significantly improve the specificity of the high-velocity pattern in the diagnosis of vasospasm. It is also necessary to evaluate the TCD results in the light of the patient clinical and systemic neuromonitoring (ICP, CPP, PtO2 if available) situation.
High-velocity Pattern in Traumatic Brain Injury
Although the main cause of poor outcome in severe TBI is high ICP (especially refractory ICH), which is not responsible for high velocity pattern, this pattern has often been reported in this context. TBI is an extremely heterogeneous disease in which the risk of simplifying a complex and dynamic pathological process is always present and physicians should keep this in mind. However, in everyday practice, it is useful to recognize the intracranial hemodynamic changes described by Martin et al. They found, in a large group of TBI patients, three consecutive ultrasonographic patterns: hypoperfusion, hyperemia and vasospasm (Figure 10.2).
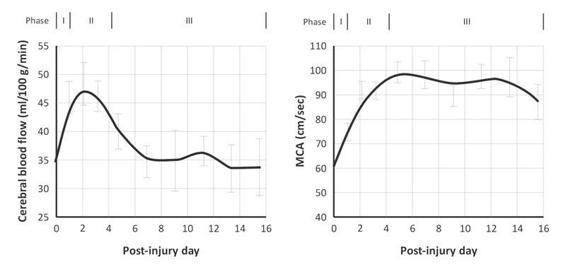
Figure 10.2. Phases found in cerebral hemodynamics in a group of severe TBI patients. Phase I, first 24 hours, hypoperfusion with low velocity. Phase II, high velocity and CBF: hyperemia stage. Phase III, high velocity, but low CBF: vasospasm stage. Note how a high velocity in the TCD does not make a diagnosis of vasospasm by itself.
Other Causes of High-velocity Patterns
Inflammatory and infectious disorders, such as cerebral vasculitis, encephalitis and meningitis, often present high-velocity patterns caused by focal (at different topography) or diffuse artery narrowing. Vasospasm is also possible in these scenarios.
Cerebral arteriovenous malformations (AVM) show a high velocity pattern explained by the existence of multiple arterio-venous low resistance shunts.
Arterial blood flow selectively passes with high velocity through these dilated veins, creating a chronically hypoperfused brain area where small arterioles and precapillary sphincters dilate as a compensatory mechanism, to maximise blood entrance and to offset chronic hypoperfusion.
During the postoperative period, after AVM excision, when chronic hypoperfusion is corrected, special attention should be paid to systemic hypertension. A severe hyperperfusion syndrome (high sonographic velocity pattern with a LI <2 ) followed by brain edema and hemorrhage can be triggered by high or even normal blood pressure levels. This situation is known as circulatory “breakthrough”. It can eventually lead to brain edema and intracranial hypertension. The same complications can appear whenever a correction of a chronic hypoperfusion state is performed, as after carotid endarterectomy.
Low-velocity Pattern: Intracranial Hypertension
ICH may complicate the course of many acute neurological diseases. In relation to pressure, according to the following formula, an ICP increase leads to a CPP decrease:
CPP = MAP – ICP
Thus, when the ICP equals the diastolic blood pressure, brain perfusion stops in diastole, and when the ICP equals the systolic blood pressure, perfusion stops completely. It should be emphasised that TCD measures FV and can indirectly estimate relative changes of the cerebral blood flow. Broadly speaking, the fundamental concept is that an ICP increase impairs the inflow of blood into the brain. Therefore, FV decreases. The first portion of the sonogram which is affected is the end diastolic velocity. Velocity is slowed in this part because it is the portion of the pulse wave during which the blood flows with lower energy. Initially peak systolic velocity increases due to cardiac compensation. As the CVR indices (PI and RI) depend on the differential velocity (FVs – FVd) they go up. When ICP increases more, all velocities decrease, but the principally affected one is always the diastolic velocity, leading to a progressive increase of the PI. This pattern of low velocity with increased PI is called high-resistance pattern. Although it can have several causes, when detected in a neurocritical patient, the treating physician should always suspect the presence of intracranial hypertension and act accordingly. An example is provided in Figure 10.3.
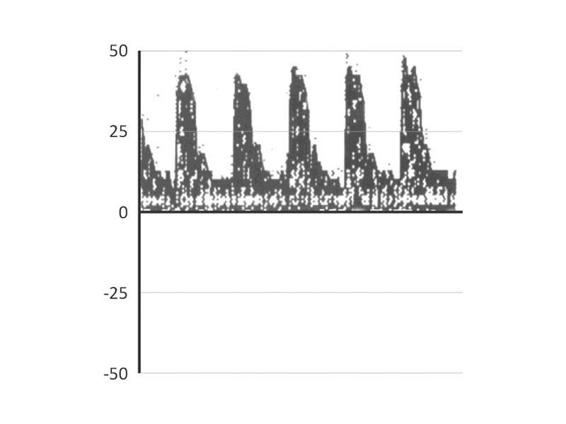
Figure 10.3. Example of a high resistance sonogram in the MCA in a 66 y.o female, after removal of a parasagittal meningioma complicated by a hematoma in the surgical site. GCS 3 under thiopental. Note the low FV (24 cm/s) and the increased PI (1.58). This study raises suspicion about the presence of ICH, and rule out the cerebral circulatory arrest diagnosis in a patient without the possibility of being clinically evaluated for being under the influence of thiopental.
Other Causes of a Low-velocity Pattern
In intensive care medicine, a low velocity pattern may be due, in addition to ICH, to:
- Arterial hypotension below the buffering capacity of the autoregulatory mechanism (severe shock of any etiology or relative hypotension in a chronic hypertensive patient with the inferior autoregulatory threshold shifted to the right). If this is the only factor causing the low velocity, the PI can be normal or decreased.
- Presence of small resistance vessels vasoconstrictor mechanisms or drugs (hypocapnia, indomethacin). It is accompanied by increased IP.
- In the first stage of TBI (24hs, see Martin´s diagram, hypoperfusion phase) there is a cerebral flow velocity reduction. The underlying mechanisms are still unclear. Some investigators have interpreted it as a cause of cerebral ischemia, but modern theories attribute it to a decreased demand by the injured brain.
10.5 Extreme Expression of Intracranial Hypertension: Cerebral Circulatory Arrest
Increases in ICP are accompanied by a decrease in all flow velocities. This phenomenon affects the diastolic phase earlier and more intensely, soon resulting in the cessation of diastolic flow (systolic peaks). A reverberating diastolic flow can then be seen (the flow that entered in systole is turned back during diastole). In the next stage there is a minimal movement of blood, only at the beginning of systole, which is known as systolic spikes. Subsequently, the flow ceases completely (the ultrasound beam cannot detect anyt blood movement). Reverberating flow and systolic spikes patterns correspond to what is accepted as “cerebral circulatory arrest” (Figure 10.3). When this pattern is found bilaterally in the anterior circulation and in the posterior sector and these alterations persist for at least 30 minutes (is not a transitory state), it can be used to support the diagnosis of brain death.
10.6 TCD as a Complementary (Auxiliary) Diagnostic Technique in Determining Brain Death
Most patients who progress to brain death have suffered severe intracranial hypertension with a concomitant decrease in cerebral perfusion pressure. This generates a global brain ischemia and ends in the irreversible loss of life-sustaining functions. The time course of the blood flow changes can be followed with TCD until a cerebral circulatory arrest pattern can ultimately be identified. An example of typical TCD alterations is provided in Figure 10.4.
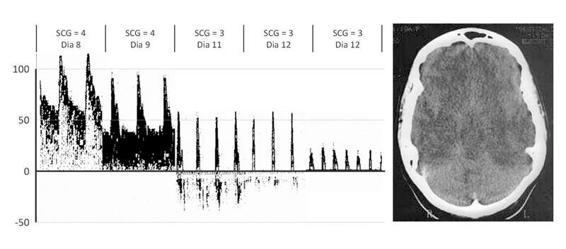
Figure 10.4. Typical TCD alterations ending in a cerebral circulatory arrest pattern in a 17-year-old girl with asthma after successful resuscitation from a hypoxic cardiac circulatory arrest. She eventually progressed to brain death (clinical diagnosis) on the 12th day. The first sonogram (left) is normal. The second shows the high-resistance pattern followed by the reverberating pattern. Finally, the third sonogram shows the systolic spikes pattern. An anoxic-ischemic brain injury may take weeks to evolve, to crebral circulatory arrest, as seen in this example. The head CT shows a white cerebellum with diffuse swelling (images from our archives).
10.7 Summary of Changes in Cerebral Hemodynamics: Muñoz Chard
The classification scheme of Muñoz [49], presented in Figure 10.5, classifies alterations of cerebral hemodynamics into three different categories corresponding to pathological PI values (increased or decreased), pathological CBFV values (high or decreased), and normal values.
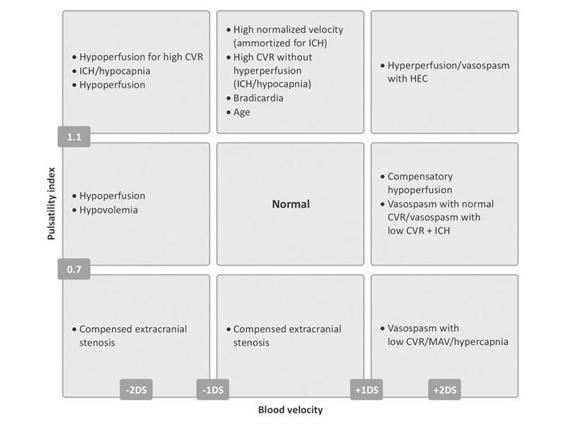
Figure 10.5. The classification scheme of Muñoz [49].
The diagram is helpful for interpreting the results of a transcranial ultrasound. It highlights five main patterns:
Related posts:
 Neuroscience Critical Care: Two Experts’ Point of View
Neurocritical Care of Patients With Arteriovenous Malformations
Neuroscience Critical Care: Two Experts’ Point of View
Neurocritical Care of Patients With Arteriovenous Malformations
 Pathophysiology of Intracranial Hypertension
Concepts and Management of Brain Death and Management of Potential Organ Donation
Pathophysiology of Intracranial Hypertension
Concepts and Management of Brain Death and Management of Potential Organ Donation
 Extracranial Atherosclerotic Carotid Artery Disease
 Surgical Treatment of Spinal Cord Injury
Stay updated, free articles. Join our Telegram channel

Full access? Get Clinical Tree


