and Róbert Bódizs2
(1)
Institute of Experimental Medicine and Institute of Neuroscience, Budapest, Hungary
(2)
Semmelweis University Institute of Behavioral Science, Budapest, Hungary
Abstract
We are dealing with the relationship between macrostructural (slope of the sleep cycles) and the microstructural dynamics. Descending (“D”) and ascending (“A”) slopes of cycles show opposite trends: “D” slope shows sleep promoting, while “A” slope shows wake/REM-promoting tendencies. Arousal-like phasic changes (PAT and CAP A2–3 phases) turned out to be overwhelming during the “A” slopes of sleep cycles, and their amount is increased from evening to morning. Within the “A” slopes their frequency increases before REM sleep periods. Sleep-like phasic changes have a different course. They are prevalent during the “D” slopes of the first sleep cycles and follow the homeostatic decay of slow wave oscillation. Accordingly, the elicitability of the two types of phasic events has opposite tendencies during night sleep from evening to morning: Arousal-like responses are prevalent during the “A” slopes and their responsivity increases, while sleep-like responses are prevalent during the “D” slopes and their elicitability decreases. Lastly, we point out the double nature of the forces behind tonic and phasic regulation: There are alternating chemical influences behind the tonic one and faster reciprocal sleep- and wake-promoting inputs behind the phasic regulation. Due to the intermingled phasic and tonic regulation, the sleeper is connected with the surrounding world and is able to execute two seemingly contradictory tasks: (1) separation for trophotropic (use dependent homeostatic) functions and (2) reactivity in form of state-dependent responses.
Keywords
Sleep cyclesDescending slopesAscending slopesMicrostructural dynamicsState-dependent reactivityTonic- and phasic-regulation of sleep4.1 Opposite Trends Across Descending and Ascending Slopes of Sleep Cycles
Since the beginning of the contemporary sleep studies, the stereotype sequences of sleep stages during sleep cycles have become well-known. The majority of studies have engaged in the characteristics of NREM-REM alternations, and the rules governing the stage sequences within the NREM cycle have received less attention. In the 1970s, researchers started to study how the sequence of NREM sleep stages influences the NREM-REM cyclicity (Brezinová 1974). One of the most important trends was to analyze the process-like behavior of the cyclic events (Caille and Bassano 1976), for example, how the preceding events or sequences determine the consecutive stages. These studies have found evidence supporting the “semi-Markov” nature of sleep stage sequences where the appearance of a certain stage depends partially on the preceding stages and partially on timing within the sleep process. Along these studies, it has become obvious that the sleep process is not only a continuous repetition of certain sequence of stages, but other long term processes from evening to morning also take place: The deepness of the cycles (the amount of slow wave sleep) decreases, while the length and density of REM periods grow from evening to morning.
However, very few studies have been devoted to look for the mechanism behind the increasing-decreasing course of sleep depth during a sleep cycle. Blake and Gerard (1937) were the first who mentioned the increasing and decreasing states and EEG differences between them. They have emphasized that decreasing and increasing states are not like mirror images. Williams et al. (1964) analyzing stage sequences in sleep of young adult persons showed that on the deepening part of sleep cycles, the stages follow an order according to their depth, while on the A part of the cycles, some stages are skipped, and this part is usually shorter compared to the D one. Sinha et al. (1972) used the asymmetry (differences in steepness) of cycle slopes to measure the progress in the sleep process and forecast the time of awakening. In an early work (Halász 1982), we studied the order of sleep stages in two human sleep experiments according to their distribution along the “D” or “A” part of the cycle. The first two cycles of six whole night sleep records of one young healthy volunteer and in a second experiment whole night sleep records of eight other volunteers were studied. Part “D” was defined as a period of sleep between the waking state/REM sleep level and the first deepest phase of the given cycle, while part “A” as those periods of sleep between the last deepest phase end and the next highest level stage in the cycle. Our results are summarized in Fig. 4.1. The sequence of stages clearly showed the expected downward and upward order of stages along the “D” and “A” part of cycles, respectively. This was supported in 94.3 and 98.5 % of stage transitions in the 6 sleep records of the same subject and in the group of eight subjects, respectively. As a next step then, we measured the duration of the “D” and “A” slope of cycles in the same sleeps. A significant difference between the duration of “D” and A slopes has been found in the six sleeps of our young volunteers. The average duration of slope “D” was 37.7 min, while the duration of the slope A was only 21.9 min (p < 0.01). The same kind of asymmetry has been found in the other eight volunteers. The number of stage shifts was also measured in the two groups. It proved to be significantly higher on the “D” slope, compared with the “A” slope. Looking for the stage jumps, when the transition skipped a stage in the depth-order of stages, the “A” slope contained more of them, and the A slopes were found to be more steep just because of the higher number of these “jumps.”
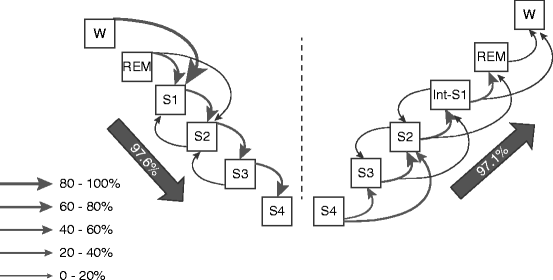
Fig. 4.1
Distribution of stage transitions during the descending and ascending slopes of sleep cycle in sleeps of eight healthy young volunteers. The thickness of the arrows indicates the occurrence (in percentage) of the indicated kind of transition. The large arrow shows that both on descending and ascending slopes of the cycle the overwhelming majority of stage transitions were going during the descending slope downward while during the ascending slope upward (Modified from Halász (1982))
Therefore, we can say that the two slopes of a certain sleep cycle reflect two different directions (downward vs. upward) of the sleep process. It seems probable that while the working mode of the “D” slope is “sleep promotion,” it is “wake/REM promotion” for the “A” slope. From a dynamic point of view, they deeply differ from each other. The consequence of this consideration means that the seemingly homogenous stage levels along different slopes of a cycle are not homogenous, for example, descending stage 2 is probably different from ascending stage 2 in several functional aspects reflecting the actual balance between sleep- and wake-promoting forces.
Another approach was taken by Merica and Fortune (1997) following the dynamic changes within a NREM cycle by power spectrum analysis. Spectral analysis provided a quantitative measure and showed how much the different oscillations (slow waves, spindles, fast frequency oscillations, etc.) coexist at all times in sleep. Their ratio defines stage assignment within the cycles. There are two important aspects in this work. One is the clear demonstration that transition from waking to sleep and further stage transitions within NREM sleep, NREM-REM transitions as well as the awakening process are all not sudden events but step by step progressive procedures, each involving transitional periods. Importantly, they also tried to trace back the EEG changes to the reciprocal inhibitory dynamics on the cellular activity level of the sleep- and wake-promoting structures. This analysis clearly demonstrates that sleep is never a static state during none of the stages, either on the “D” or the “A” slopes of the cycles. They measured the simultaneous power-time courses during the cycles and demonstrated the characteristic composition pattern of delta waves, sigma spindles, and beta activity shaping the less steep “D” and steeper “A” slopes of cycles. This time course of the different frequencies may be the result of the progressive decrease in the firing rate of wake-promoting neurons. It results in diminished excitatory input to the thalamus and a consequent, gradual hyperpolarization of the thalamic relay cells, building up the burst-firing pattern, leading first to spindling and later to develop delta activity. Interestingly, during the “D” slope of cycles they have found multiple delta peaks, instead of one monotonic rise of deltas, and they assumed a correlation of this phenomenon with CAP events, otherwise not taken into consideration in their work.
The structure of sleep cycles, at least that of the first three ones is obviously shaped by an asymmetric (longer) “D” and (shorter) “A” slope. The “turning point” from deep sleep during the first cycles is very characteristic and frequently marked by a sudden movement. (This period is “abused” by pathological arousal events in children with pavor nocturnus and adults with night terror). The dynamics of this period and subsequent uprising course of sleep leading to REM sleep need further explanation.
4.2 Distribution of Phasic Events and Micro-arousals Across the Sleep Process
4.2.1 The Distribution of PAT-Like Micro-arousals Across the Sleep Process
The distribution of PAT is not homogeneous across the sleep cycles: They are more frequent during the A slopes of the cycles compared with the D slopes, and their frequency increases from evening to morning (Schieber et al. 1971). These early findings were confirmed by Halász (1982) and also later after coining the American Sleep Disorders Association (ASDA) criteria of arousal (ASDA 1992; Terzano et al. 2002). The distribution of arousals consistent with ASDA criteria has followed similar distribution during night sleep: increasing from evening to morning (Terzano et al. 2002).
4.2.2 The Distribution and Dynamics of K-Complexes Across the Sleep Process
Regardless of the level of sleep or sleep stage, the number of K-complexes seems to correlate with the actual direction of sleep process. In our earlier studies (Halász 1982), the number of K-complexes during the stage 2 sleep periods was rather variable. When the “D” types (preceded by a more superficial sleep stage and followed by a deeper one) and the A type ones (preceded by deeper one and followed by a more superficial one) were compared, a significant difference was found in the number of K-complexes. “A” type contained more K-complexes than the “D” type. K-complex number proved to be in positive correlation with the deepness of the actual cycle. K-complex frequency decreased across the night sleep from evening to morning, according the serial order of cycles, parallel with the well-known course of the S-process of Borbély. Under the influence of psychostimulant drug, this effect ceased together with the regular course of slow wave decay (Fig. 4.2). Unlike types D, a shift in the frequency of K-complexes was very characteristic for type A stage 2.
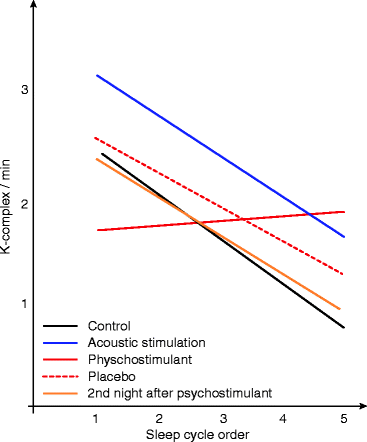
Fig. 4.2
Regression lines for average K-complex densities as functions of sleep cycle order and different treatment conditions in eight healthy adult subjects. K-complex values have shown decreasing tendencies from evening to morning in all the studied conditions except under influence of psychostimulant (parallel with the missing of the regular slow wave decay). The highest value of K-complexes was observed under acoustic stimulation (Acoustic stimulation consisted of pseudo-random 200 Hz tone clicks with durations of 10 ms and an average inter-stimulus interval of 40 s) (Modified from Halász et al. (1985))
Continuously or periodically applied random acoustic stimulation increased the number of all registered K-complexes but simultaneously decreased the number of the spontaneous ones. This change is similar to the behavior of PAT, as seen before in Chap. 3. An analysis of the K-complex number distribution during stimulation nights showed that the increase of K-complexes could mainly be attributed to an elevation of the number of type A stage 2 periods. Comparing the “A” and “D” slopes of sleep cycles, K-complex rates along proved to change more on “A” slopes and less on “D” slopes (Fig. 4.3).
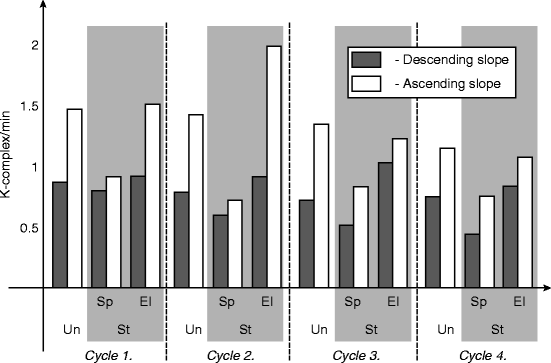
Fig. 4.3
Average number of K-complexes/min in spontaneous and stimulated stage 2 sleeps during descending and ascending slopes of a healthy young volunteer. Un undisturbed night, St stimulated night, Sp spontaneous K-complexes, El elicited K-complexes
Also, these studies showed again very clearly the double nature of K-complex: behaving like an arousal pattern that can be triggered by acoustic stimuli and at the same time changing parallel with the delta activity that means dampening along the sleep process, and their rate is related to the depth of the actual sleep cycle. So we can say that K-complex formation is partially associated with phasic sensorial inputs and partially with the degree of sleep synchronization, for example, depth of sleep.
Related posts:
 The Need of Slow Wave Activity and Cognitive Functions
 Dynamic NREM Sleep Regulation Models
 Changing Views of NREM Sleep Homeostatic Regulation
 Slow Wave Activity as Substrate of Homeostatic Regulation
 Homeostatic Features of the CAP System and the Physiological Mechanism of Reactive Slow Wave Activity
 Recognition of Spontaneous and Evoked Arousal- and Sleep-Like (Antiarousal) Phasic Events
Stay updated, free articles. Join our Telegram channel

Full access? Get Clinical Tree


