Fig. 15.1
KS and CS expression after spinal cord injury. (a) Expression profile of 5D4-reactive KS in wild-type mice after spinal cord injury. Scale bar, 100 μm. (b–d) KS was expressed around the lesion center 7 days after injury in wild-type mice (b) but was not detected in GlcNAc6ST-1−/− mice (c) or isotype-matched IgG controls (d). (e) RT-PCR for GlcNAc6ST-1 and GAPDH was performed for samples from the wild-type mouse spinal cord 7 days after injury or sham operation. (f) Quantification of CS expression. Quantification data are the means ± SEM. ns, not significant (Student’s t-test). The sections shown are midline sagittal sections of the injured spinal cord. The drawn lines indicate the margins of the lesion core (a) and the outline of the spinal cord (b, c)
15.2.2 Motor Functional Tests and Motor-Evoked Potential
To evaluate motor functional recovery after SCI, we performed the footfall test and footprint test. For the footfall test, mice were placed on a lattice of thin metal wires. The wire grid was positioned flat and was 7 × 11 in with grid squares of 0.35 × 0.35 in. This test can evaluate accurate limb placement and precise motor control. Intact animals cross the grid without making footfalls, whereas a paralytic foot tends to fall from the lattice during movement. The numbers of footfalls were almost the same between wild-type and GlcNAc6ST-1−/− mice 3 days after injury (Fig. 15.2a). At 4–6 weeks after injury, GlcNAc6ST-1−/− mice showed the functional recovery comparable to that of sham-operated mice and a significantly better recovery than wild-type mice (Fig. 15.2a). The stride length examination also demonstrated a significantly better functional recovery in GlcNAc6ST-1−/− mice (Fig. 15.2b). The Basso mouse scale (BMS) score [14] for 8 weeks also showed a significantly better recovery in the GlcNAc6ST-1−/− mice than in the wild-type mice (Fig. 15.2c).
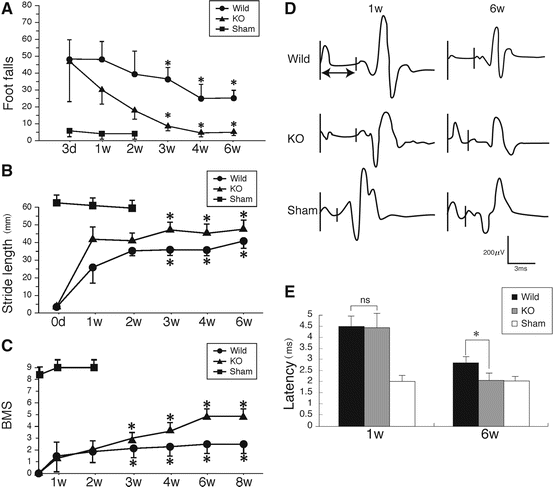

Fig. 15.2
Footfall, footprint tests, and BMS scoring. (a) Footfall test. The graph shows data for each genotype at each time point. *p < 0.05 (wild-type vs. GlcNAc6ST-1−/− mice). (b) Data of the footprint test taken 4 weeks after injury are quantified. *p < 0.05 (wild-type vs. GlcNAc6ST-1−/− mice). Quantification data are the means ± SEM (repeated measures ANOVA and the Mann–Whitney U-test). (c) BMS scoring. *p < 0.05 (wild-type vs. GlcNAc6ST-1−/− mice). (d, e) Motor-evoked potential. (d) Representative profiles of motor-evoked potential are shown. (e) Latency times were quantified. *p < 0.05. Quantification data are the means ± SEM (one-way ANOVA)
Then we measured the latency of motor-evoked potential (MEP) to further objectively evaluate motor function. Mice received electrical stimuli at the occipito-cervical area, and MEP was recorded at both hind limbs. The onset latency of MEP was measured from the onset of the stimulus to the first response of each wave. At 6 weeks after injury, the latency of GlcNAc6ST-1−/− mice became comparable to that of the sham-operated controls and significantly shorter than wild-type mice (Fig. 15.2d, e). From these data, the functional recovery was significantly better in GlcNAc6ST-1−/− mice.
15.2.3 Glial Scar Formation
We next examined collagen IV, which expresses in the late stages of glial scarring [15]. Collagen IV expression at 1 week after injury was apparent, but the margin was unclear in both wild-type and GlcNAc6ST-1−/− mice. There was no difference in the collagen IV-positive area at 1 week between these mice. The margin of the scar area became clear at 4 weeks after injury, and the scar area was significantly reduced in GlcNAc6ST-1−/− mice (Fig. 15.3a, b).
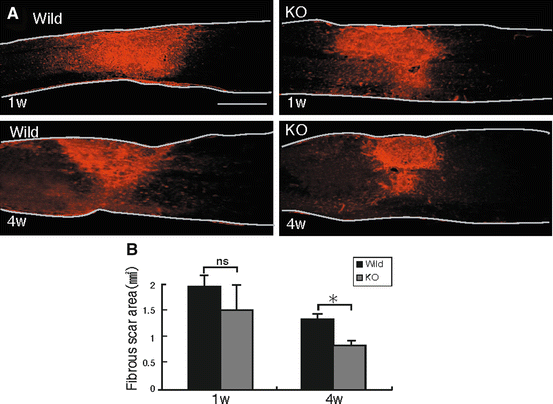

Fig. 15.3
Glial scar assessment by collagen IV deposition. (a) Representative photos for collagen IV expression are shown. Scale bar, 500 μm. The drawn lines indicate the outline of the spinal cord. (b) The collagen IV-positive areas are summarized in the graph. *p < 0.05. Quantification data are the means ± SEM (Student’s t-test). The sections shown are midline sagittal sections of the injured spinal cord
15.2.4 Neuronal Axon Growth
We stained tissues 5 mm distal to the lesion for 5-hydroxytryptamine (5HT) as the serotonergic descending raphespinal tract. 5HT-positive fibers were significantly more in the ventral horn of the gray matter in GlcNAc6ST-1−/− mice than in wild-type mice (5HT-positive area: wild-type, 972 ± 1,080 vs. GlcNAc6ST-1−/−, 7,120 ± 1,168 μm2; p < 0.005) (Fig. 15.4a–c). GAP43-positive axons which reflect axon regeneration and sprouting were also more in GlcNAc6ST-1−/− mice than in wild-type mice at 4 weeks after injury (GAP43-positive fiber counts/150,000 μm2: wild-type, 1,962 ± 1,522 vs. GlcNAc6ST-1−/−, 6,631 ± 1,090; p < 0.005) (Fig. 15.4d–f). In tracer-fiber counts for the corticospinal tract (CST), the number of biotin-dextran amine (BDA)-positive fibers was increased in the region caudal to the epicenter in GlcNAc6ST-1−/− mice, particularly in the gray matter (Fig. 15.4g–i). The quantification of the number of labeled BDA fibers was performed in the gray matter 5 mm caudal to the lesion and divided by the number of labeled corticospinal axons 10 mm rostral to the lesion for each animal. There was a significant difference between wild-type and GlcNAc6ST-1−/− mice (BDA-positive fibers in caudal region/rostral region: wild-type, 1.9 ± 1.1% vs. GlcNAc6ST-1−/−, 6.9 ± 1.0 %; p < 0.005).
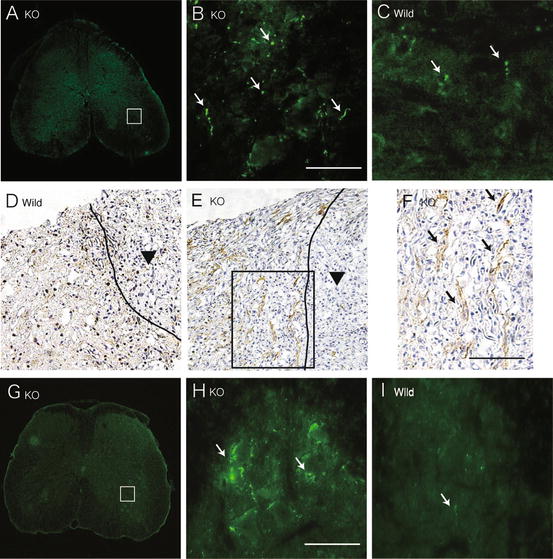

Fig. 15.4
Axonal growth. 5HT staining of the ventral horn (a–c; 5 mm distal to the lesion), GAP43 staining (d–f), and tracer-fiber counts of the corticospinal tract (BDA-positive fibers) (g–i; 5 mm caudal to the lesion) are shown for GlcNAc6ST-1−/− (a, b, e, f, g, h) and wild-type (c, d, i) mice. Scale bar, 50 μm. Higher magnification figures of the boxed areas in a, e, and g are shown in b, f, and h, respectively. The arrows in b, c, f, and h, i indicate 5HT-positive, GAP43-positive, and BDA-positive fibers, respectively. The arrowheads in d and e indicate the contusion area. The drawn lines indicate the margins of the lesion core. Five mice were used for each genotype at 4 weeks after injury. The sections in a, b, c, g, h, and i are the axial sections of the injured spinal cord. The sections in d, e, and f are the midline sagittal sections of the injured spinal cord
15.2.5 Spot Assay
We used the spot assay to examine the activity of mouse brain proteoglycans. We confirmed both KS and CS in the mouse brain proteoglycans (Fig. 15.5a). We then spotted these proteoglycans with rhodamine B, which appeared red (Fig. 15.5b). While neurites of the primary neurons frequently crossed into the spots in the control (rhodamine B alone, the upper panel of Fig. 15.5b), neurites of neurons in the surrounding area did not cross into the spots of the mouse brain proteoglycans (the middle panel of Fig. 15.5b). On the other hand, neurites of neurons in the surrounding area could enter the spots of the proteoglycans which were treated with keratanase (the bottom panel of Fig. 15.5b). This finding was clearer when the seeded cell number was decreased (Fig. 15.5c). Therefore, this in vitro assay employing brain proteoglycans mimicked the in vivo failure of axonal regrowth into the lesions of SCI and the reversal of this failure in KS-deficient mice.
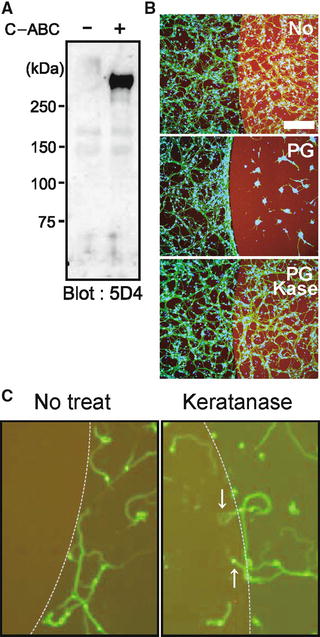

Fig. 15.5
Spot assay. (a) Proteoglycans from mouse brain were subjected to Western blot analysis. Note that C-ABC treatment revealed KS epitopes. (b, c) Spot assay. Mouse brain proteoglycans at 3 μg/mL were spotted, and primary granular neurons from the rat cerebellum were seeded. Proteoglycans inhibited neurite entry into the spot, whereas keratanase treatment allowed entry. Different cell numbers were used for (b) and (c) (1.0 × 10⁶ or 1.0 × 10⁵/well, respectively). Scale bar, 100 μm
From these results, KS knockout mice (N-acetylglucosamine 6-O-sulfotransferase-1-deficient mice) show better functional recovery after SCI with axon regeneration/sprouting. Next study was conducted to evaluate whether KS-degrading enzyme promotes axonal regrowth and functional recovery after SCI in rats.
15.3 Keratan Sulfate-Degrading Enzyme (Keratanase II) Promotes Axonal Regeneration and Functional Recovery After Spinal Cord Injury
15.3.1 Degradation of KS by K-II In Vitro and In Vivo
We purified K-II from Bacillus circulans which showed keratanase activity only [16]. This enzyme is thermostable and keeps its enzymatic activity for at least 120 h at 37 °C (100 ± 1.606 % at 0 h vs. 91.9 ± 4.014 % at 120 h). We made contusion injuries using a force of 200 kdyn with IH impactor in the rat spinal cord at the ninth thoracic vertebral level. This contusion model completely destroyed the dorsal columns and dorsal CST in the spinal cord.
Di-sulfated KS and CS-C contents increased after injury, peaking around 7 days (Fig. 15.6a, b). K-II or C-ABC was administered to the injured site for 2 weeks after contusion injuries using an osmotic pump with K-II (0.05 units/200 μL), C-ABC (0.05 units/200 μL) (Seikagaku, Tokyo, Japan), or saline (as a vehicle control) (200 μL solution, 0.5 μL/h, 14-day delivery; Alzet pump model 2002 [Durect Co., Cupertino, CA]).
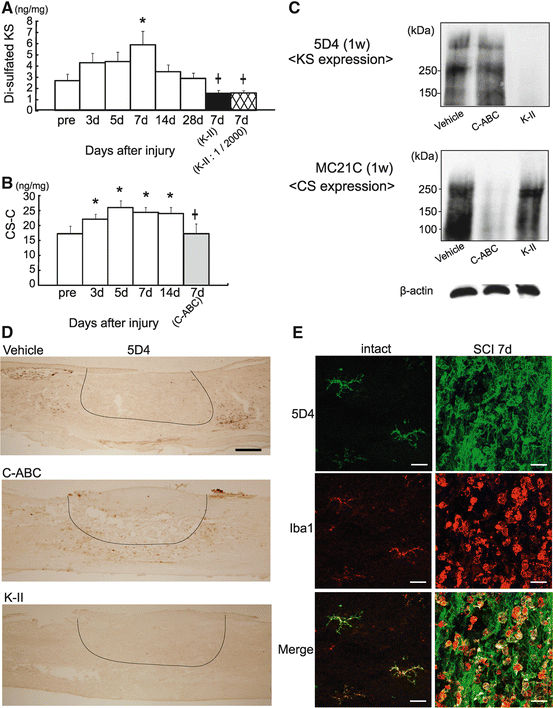
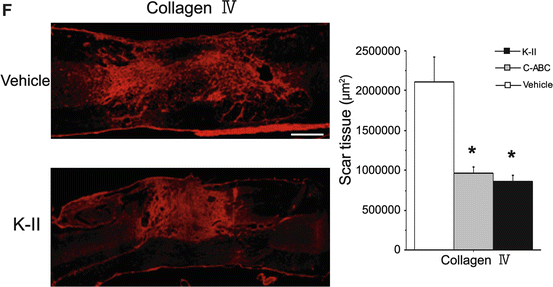


Fig. 15.6
Specific degradation of KS by K-II. (a) Amounts of di-sulfated KS after SCI. A 10-mm fragment of the injured spinal cord was subjected to the analysis. Data represent the means ± SEM. *p < 0.05 vs. the preinjured specimen (pre). +, p < 0.05 vs. 7 days. n = 5 in each group. K-II, 0.05 units of K-II were administered to the spinal cord; K-II 1/2000, 0.0000025 units of K-II were administered to the spinal cord. (b) Amounts of CS-C after SCI. *p < 0.05 vs. pre. +, p < 0.05 vs. 7 days. n = 6 in each group. C-ABC, 0.05 units of C-ABC were administered to the spinal cord. (c) Rats were treated with K-II or C-ABC for 1 week after spinal cord injury. A 10-mm specimen of the injured spinal cord was subjected to Western blot analysis for 5D4-reactive KS, MC21C-reactive CS, and β-actin. (d) 5D4-reactive KS was visible in the penumbra region in vehicle-treated and C-ABC-treated rats, but not in K-II-treated rats. These rats were treated with the Fig. 15.6 (continued) indicated enzyme for 1 week after spinal cord injury. Scale bars, 500 μm. All photos are of sagittal sections with the left side rostral. (e) Double staining for KS (5D4) and microglia (Iba1). The left panels show the intact spinal cord, and the right panels show the spinal cord 1 week after injury. Most 5D4-reactive cells overlapped Iba1-positive cells, which indicated that KS was mainly expressed by microglia. The left images showed ramified microglia expressing 5D4-KSPG. The right images show that 5D4-KSPG expression is seen on characteristic cellular profiles with short processes and a less ramified morphology after SCI. Scale bars, 20 μm. (f) Immunohistochemistry of collagen IV at 2 weeks after SCI. The area of collagen IV-positive scarring was significantly decreased in K-II- and C-ABC-treated rats. Scale bar, 500 μm. Right side, quantitative analysis of the expression of collagen IV was performed at 2 weeks after SCI. 2,900 × 2,200 μm counting frames around a lesion were analyzed. Data represent the means ± SEM. *p < 0.01 vs. the vehicle control (n = 5 vehicle; n = 5 C-ABC; n = 5 K-II)
K-II degraded di-sulfated KS contents to the noninjury level (Fig. 15.6a). Western blot and immunohistochemistry revealed that the reactivity to KS antibody 5D4 (Seikagaku, Tokyo, Japan) was lost in rats treated with K-II for 7 days after injury, but not in C-ABC-treated rats (Fig. 15.6c, d). The smear appearance in Western blot is the nature of proteoglycans, which is due to the long sugar chains. The granular staining profile of microglia represented the main source of KS expression. (Fig. 15.6e). From these data, K-II worked in vivo although not completely abolished KS. The in vivo degradation of CS by C-ABC, but not that by K-II, was also confirmed (Fig. 15.6b, c).
Furthermore, we also performed immunohistochemistry of collagen IV for glial scar evaluation at 2 weeks after SCI. The area of collagen IV-positive scarring was significantly decreased in K-II- and C-ABC-treated rats (Fig.15.6f).
15.3.2 Motor Function Recovery by K-II Administration
Motor function recovery was evaluated with the Basso, Beattie, and Bresnahan (BBB) scores [17] and %grip test. In %grip test, paw placement for each limb on the grid bar was assessed as the animal walked on a plastic-coated wire mesh grid (50-cm length × 33-cm width × 20-cm height, with 2.5 × 2.5-cm openings) for 3 min. Steps in which the paw gripped the grid bar and supported the animal’s weight were counted as correct. The percentage of correct paw placements was calculated for each hind limb and averaged. K-II led to a striking recovery of motor function; the effect was similar to that of C-ABC (Fig. 15.7a, b). To determine an appropriate dose of C-ABC, we examined several doses and found that at the doses of 0.05, 0.1, and 1.0 units/200 μL, C-ABC showed a comparable effect on motor function recovery, while the dose of 0.025 units/200 μL showed a less potent effect (Fig. 15.7c). Therefore, we used 0.05 units/200 μL of C-ABC in this study. We also determined the dose of 0.05 units/200 μL of K-II (Fig.15.7d). The MEP was also performed as the observed motor function recovery, in which an electric stimulus is given at the thoracic level (Th7) and a response is taken at the gastrocnemius muscles (Fig. 15.7e). This functional recovery was due to the enzymatic activity of K-II, as heat-inactivated K-II did not promote motor function recovery at all (Fig. 15.7f). Interestingly, the combination of K-II and C-ABC showed neither additive nor synergistic effects (Fig. 15.7e, g).
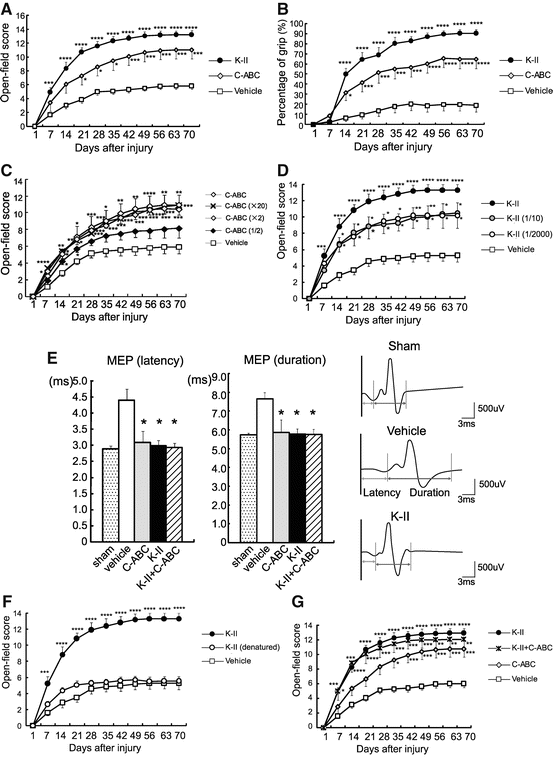

Fig. 15.7


Motor function recovery by K-II after SCI. (a, b) The BBB score and %grip test data after SCI. Recovery was significantly better in the K-II and C-ABC treatment groups than in the vehicle-administered control. Data represent the means ± SEM. *p < 0.05; ***p < 0.005; ****p < 0.001 vs. the vehicle control (n = 10 K-II (0.05 units); n = 7 C-ABC (0.05 units); n = 10 vehicle). (c) Motor function recovery after SCI in rats treated with C-ABC at various doses. C-ABC promoted functional recovery at the doses of 0.05 units, 0.1 units (×2), and 1.0 units (×20) better than 0.025 units (1/2). Data represent the means ± SEM. *p < 0.05; **p < 0.01; ***p < 0.005; ****p < 0.001 vs. the vehicle control (n = 5 in each group). (d) Motor function recovery after SCI in rats treated with K-II at various doses. K-II promoted functional recovery at a concentration of Fig. 15.7 (continued) 0.05 units and even restored motor function at concentrations of 0.005 units (1/10) and 0.0000025 units (1/2000). Data represent the means ± SEM. *p < 0.05; **p < 0.01; ***p < 0.005; ****p < 0.001 vs. the vehicle control (n = 7 K-II; n = 5 K-II (1/10); n = 6 K-II (1/2000); n = 7 vehicle). (e) Electrophysiologic tests using motor-evoked potential (MEP) also showed functional recovery in the treatment groups at 8 weeks after SCI. Data represent the means ± SEM. *p < 0.05 vs. the vehicle control (n = 8 sham; n = 9 vehicle; n = 5 C-ABC (0.05 units); n = 7 K-II (0.05 units); n = 7 K-II+C-ABC (0.05 units each)). (f) Heat-denatured K-II failed to promote motor function recovery after spinal cord injury. Data represent the means ± SEM. ***p < 0.005, ****p < 0.001 vs. the vehicle control (n = 7 K-II (0.05 units); n = 5 heat-denatured K-II; n = 7 vehicle). (g) The combination of K-II and C-ABC did not show additive or synergistic effects on motor function (BBB score). Data represent the means ± SEM. *p < 0.05; **p < 0.01; ***p < 0.005; ****p < 0.001 vs. the vehicle control [n = 9 vehicle; n = 7 C-ABC (0.05 units); n = 11 K-II (0.05 units); n = 7 K-II+C-ABC (0.05 units each)]
Stay updated, free articles. Join our Telegram channel

Full access? Get Clinical Tree


