Fig. 1
Age distribution of 327 patients

Fig. 2
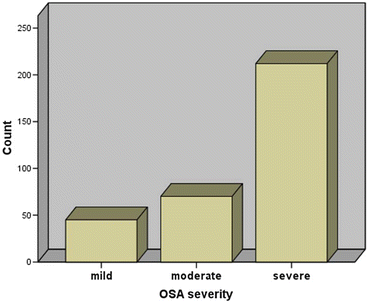
Distribution of OSA severity: 45 (13.8 %) cases were mild OSA, 70 (21.4 %) cases were moderate OSA, and 212 (64.8 %) cases were severe OSA
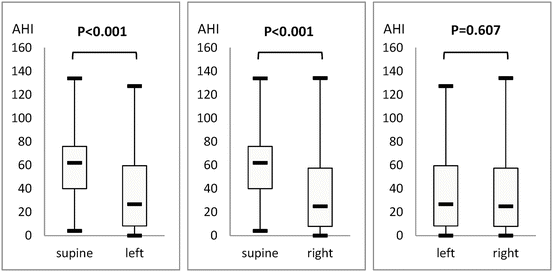
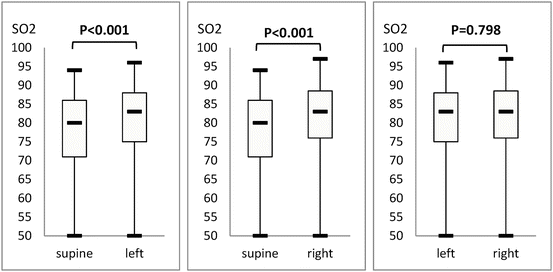
The percentages of total sleep time spent in supine and left and right lateral decubitus positions showed no differences (33.5 % ± 6.7 %, 32.8 % ± 8.2 %, and 33.2 % ± 8.6 %, respectively; P = 0.483, Table 1). No significant difference could be found in the percentages of REM sleep in supine and left and right lateral decubitus positions (6.1 % ± 4.2 %, 6.5 % ± 4.2 %, and 6.4 % ± 4.2 %, respectively; P = 0.424, Table 1). Supine AHI was 60.5 ± 24.3 per hour, which was higher compared to 36.4 ± 28.4 per hour in the left lateral decubitus position (P < 0.001) and 35.3 ± 28.1 per hour in the right lateral decubitus position (P < 0.001, Table 1 and Fig. 3). In the supine position, the minimum SaO2 was 76.5 % ± 10.8 %, which was lower compared to 80.0 % ± 10.2 % in the left lateral decubitus position (P < 0.001) and 80.0 % ± 10.1 % in the right lateral decubitus position (P < 0.001, Table 1 and Fig. 4). No significant difference could be found between left and right AHI (P = 0.607), and between left and right minimum SaO2 (P = 0.798).


Table 1
Comparison of supine and left and right lateral decubitus positions
Supine | Left lateral decubitus | Right lateral decubitus | P-value | |
|---|---|---|---|---|
Sleep time (% TST) | 33.5 ± 6.7 | 32.8 ± 8.2 | 33.2 ± 8.6 | 0.483 |
REM (% TST) | 6.1 ± 4.2 | 6.5 ± 4.2 | 6.4 ± 4.2 | 0.424 |
AHI (per hour) | 60.5 ± 24.3 | 36.4 ± 28.4 | 35.3 ± 28.1 | <0.001 |
Min SaO2 (%) | 76.5 ± 10.8 | 80.0 ± 10.2 | 80.0 ± 10.1 | <0.001 |

Fig. 3
Supine AHI was 60.5 ± 24.3 per hour, which was higher compared to 36.4 ± 28.4 per hour in left position (P < 0.001) and 35.3 ± 28.1 per hour in right position (P < 0.001). No statistically significant differences could be found between left and right AHI (P = 0.607)

Fig. 4
Minimum SaO2 in supine position was 76.5 ± 10.8 %, which was lower compared to 80.0 ± 10.2 % in left position (P < 0.001) and 80.0 ± 10.1 % in right position (P < 0.001). No statistically significant differences could be found between left and right minimum SaO2 (P = 0.798)
Factors Influencing the Prevalence of Left and Right Positional OSA: Effect of Gender, Age, BMI, and OSA Severity
Based on the definition of left and right positional OSA mentioned earlier, out of 327 OSA patients, left positional sleep apnea was seen in 155 (47.4 %) patients, and right positional sleep apnea was seen in 161 (49.2 %) patients. The prevalence of left and right positional OSA showed no difference (P = 0.639). Subgroup analysis using gender, age, BMI, and OSA severity showed no statistically significant difference between the prevalence of left and right positional OSA (Table 2). Prevalence of left and right positional OSA was not affected by gender or age. However, as BMI and AHI increased, prevalence of left and right positional OSA decreased (Table 2).
Table 2
Factors influencing the prevalence of left and right positional OSA: effect of gender, age, BMI, and OSA severity
Factors | No. | Supine AHI/left AHI > 2 | Supine AHI/right AHI > 2 | P-value |
|---|---|---|---|---|
Total | 327 | 155 (47.4 %) | 161 (49.2 %) | 0.639 |
Gender | ||||
Male | 314 | 148 (47.1 %) | 155 (49.4 %) | 0.576 |
Female | 13 | 7 (53.8 %) | 6 (46.2 %) | 0.695 |
P-value | 0.635 | 0.821 | ||
Age (years) | ||||
18–39 | 128 | 65 (50.8 %) | 67 (52.3 %) | 0.802 |
40–59 | 168 | 77 (45.8 %) | 81 (48. 2 %) | 0.662 |
≥60 | 31 | 13 (41.9 %) | 13 (41.9 %) | 1.000 |
P-value | 0.570 | 0.542 | ||
BMI (kg/m2) | ||||
Normal | 49 | 30 (61.2 %)* | 30 (61.2 %)* | 1.000 |
Overweight | 161 | 85 (52.8 %)* | 88 (54.7 %)* | 0.737 |
Obesity
Stay updated, free articles. Join our Telegram channel
Full access? Get Clinical Tree
 Get Clinical Tree app for offline access

| ||||


