Fig. 24.1
MRI of patient #1 (upper row T2-weighted, lower row gadolinium-enhanced T1 image): onset with a single right parieto-occipital lesion (a, d). Subsequent lesions at 23 months (b, e) and at 29 months (c, f). (g–j) Histology (biopsy): the white matter shows focal hypercellularity and perivascular lymphocytic cuffs (arrows in g). Abundant macrophages are visible in the hypercellular areas (h). There is loss of myelin (i) with relative sparing of axons (arrowheads in j). Stainings: g, h hematoxylin and eosin, (i) luxol fast blue/PAS, (j) immunohistochemistry for neurofilament. Magnifications: g ×100, h–j ×400 (Published in J Neurol (Häne et al. 2011), with kind permission)
Patient 2. A 56 year old man presented with headaches, speech difficulties and seizures. MRI of the brain showed a non-enhancing single left parietal lesion (Fig. 24.2a). The lesion was moderately positive on amino acid PET (F-18 ethyl-fluoro-tyrosine) which is compatible with low-grade glioma. Blood cell and CSF analysis were normal. No biopsy was made at this stage and anticonvulsive treatment with phenytoin was started. The follow up MRI 6 weeks later showed spontaneous regression of the lesion. Two months later the patient was again hospitalized with confusion, right-sided hemihypesthesia and seizures. The MRI showed progression of the left parietal lesion as well as several new lesions in the left frontal and right fronto-temporal white matter (Fig. 24.2b, c). Biopsy of the frontal lesion revealed inflammation with perivascular CD20 positive cells which was compatible with demyelination. No tumor cells were present. Treatment with dexamethasone was started (16 mg/day). The patient clinically improved and in a follow-up MRI 3 months later there was substantial regression of all lesions. Twenty-six months after the first presentation the patient suffered from speech difficulties. MRI revealed a new lesion in the right insular region. Dexamethasone therapy was resumed and led to clinical improvement within 3 weeks. This was paralleled by regression of the lesion as shown on MRI. At last follow-up 44 months after disease onset the patient showed residual mild aphasia and cognitive dysfunction. There was no clinical or imaging evidence of tumor in and outside the brain. The clinical course, imaging and biopsy findings in this patient are compatible with TD.
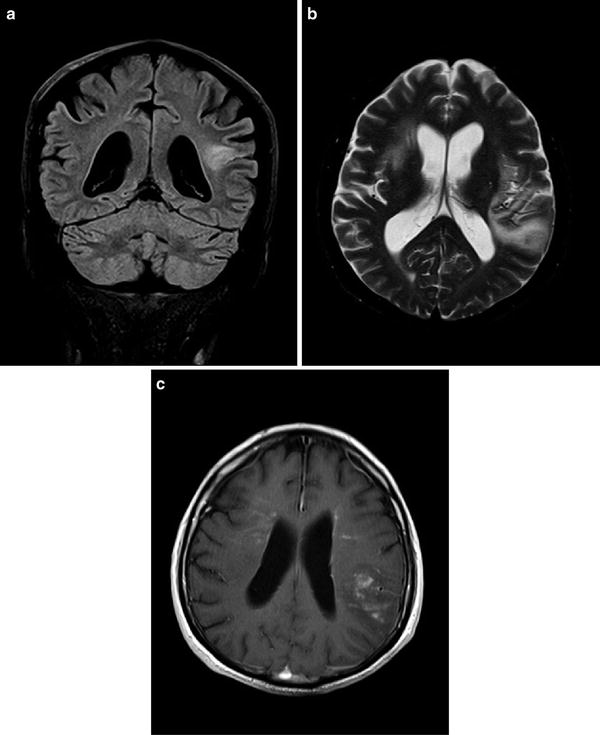
Fig. 24.2
MRI of patient #2: A single left parietal lesion was present at the time of first manifestation of TD (a); coronal FLAIR image). At the time of first recurrence bilateral space occupying lesions were observed (b), axial T2-weighted image). The lesions now showed mild contrast-enhancement (c), axial gadolinium-enhanced T1-weighted image)
Epidemiology
TD can be found in all age groups. However, more than 50% occur in the third to fifth decade. Overall the incidence of ‘idiopathic’ TD appears to be low. TD represents the first manifestation of newly diagnosed multiple sclerosis in 1–2 per 1,000 cases (Poser et al. 1992). An accurate number on the incidence of ‘idiopathic’ TD can not be given also since the term TD is heterogeneously used.
Clinical Course
Most TD patients present with an acute to subacute onset. As illustrated in our cases single or multiple lesions can develop at various sites of the brain over time. The majority of lesions are located within the brain. Rarely do they grow in the spinal cord (Xia et al. 2009). Recurrences are frequently observed. In most patients there is no preceding viral infection or vaccination. The clinical course is variable. In the series presented by Kepes 31 patients were observed up to 12 years (Kepes 1993). The diagnosis of TD was established in these patients by biopsy. Twenty-three of them developed no additional lesions, but showed remissions over many years, and may be considered as ‘idiopathic’ TD. Lucchinetti et al. (2008) reported on a group of 168 patients with biopsy confirmed lesions classified as ‘CNS inflammatory demyelinating disease’. After a median follow-up of 3.9 years 14% remained with an ‘isolated syndrome’ which however was not further specified, whereas 70% developed definite MS (Lucchinetti et al. 2008). In other cases CNS lymphoma occurred within months (Alderson et al. 1996) to several years (Ng et al. 2007) from the onset of TD.
Diagnosis/Differential Diagnosis
The differentiation of TD from MS, glioma, CNS lymphoma and infection can be challenging and is essential in terms of treatment strategies. In the following we will briefly summarize diagnostic tools applied to evaluate the above mentioned differential diagnoses.
Imaging
Anatomical MRI using T1 and T2 weighted, contrast enhanced and FLAIR sequences is not capable to derive parameters specific for TD. Central necrosis, cystic degeneration and contrast enhancement may occur in TD but represent also typical features of high-grade glioma and lymphoma. Diffusion weighted MRI measures the restriction of water diffusion and allows to differentiate brain abscess, which shows high diffusion restriction in the lesion center, from gliomas. In accordance it may be suitable to differentiate abscess from TD (Abou Zeid et al. 2012). Perfusion CT can estimate the intra-lesional blood volume and may assist to differentiate TD from high grade glioma where an increased tumor blood volume is present due to neo-angiogenesis in most cases. Although mean blood volume values are significantly higher in high-grade gliomas compared with TD (Jain et al. 2010) there is considerable overlap between these groups (TD: 0.71–1.23 ml/100 g, high-grade glioma: 0.71–4.49 ml/100 g). No criteria exist for other imaging modalities. Magnetic resonance spectroscopy can detect patterns of abnormal choline, lactate, and lipid peaks in MS, however, substantial overlap with TD can be expected (Cianfoni et al. 2007; Saini et al. 2011). Diffusion tensor imaging (DTI) which provides information on the integrity of fiber tracts could aid in the differential diagnosis of TD, however, no validated data have been reported yet. Positron emission tomography (PET) and single photon emission computed tomography (SPECT) may reveal alterations of glucose metabolism and amino acid uptake in TD. However, these findings are non-specific and are usually also present in gliomas and lymphomas.
Related posts:
 Oligodendroglial Tumors: Intra-arterial Chemotherapy
The Concept of a Preniche for Localization of Future Metastases
Resection of Brain Tumors: Intraoperative Confocal Microscopy Technology
Oligodendroglial Tumors: Intra-arterial Chemotherapy
The Concept of a Preniche for Localization of Future Metastases
Resection of Brain Tumors: Intraoperative Confocal Microscopy Technology
 Management of Hemangiopericytoma
 Metastatic Oligodendroglioma: Diagnosis with Fine-Needle Aspiration Cytology
 Lipoma: An Overview
Stay updated, free articles. Join our Telegram channel

Full access? Get Clinical Tree


