Vascular Imaging in Ischaemic Stroke and TIA


Vascular Imaging in Ischaemic Stroke and TIA


Introduction

Acute brain ischaemia is the expression of primary vascular, and not brain, pathology. Accurate diagnosis of the vessel pathology is urgent and essential if appropriate timely treatment is to be given. This chapter includes details and examples of vascular imaging in patients presenting with acute ischaemia and those attending with a presumed transient ischaemic attack (TIA). The technique is identical and many of the imaging findings are similar. In all cases vascular imaging is required as soon as possible after the event. The risk of further events is highest soon after the initial event. Treatment for the underlying vascular cause should be performed as soon as possible to have maximal future protective effect.

In the past, imaging has been concentrated upon an assessment of the common carotid bifurcation. This is due to the data from the European and American studies comparing medical and surgical treatment of carotid territory stroke in the ECST and NASCET trials. In these, digital subtraction angiography (DSA) was the only vascular imaging used.

The advent of MDCT, and especially 64-slice CT, now offers a new and exciting method of assessing the entire cerebral vasculature, from arch to Circle of Willis in only 6 seconds. This is also important as reanalysis of the earlier trials shows that aortic disease can be responsible for ongoing ischaemic events. Posterior circulation ischaemia, increasingly recognized as a cause of stroke in young adults, was largely ignored in previous studies. Doppler ultrasound, a commonly used screening examination, covers little of the necessary vessels, and is of limited value. MDCTA provides a new solution to all these imaging requirements.

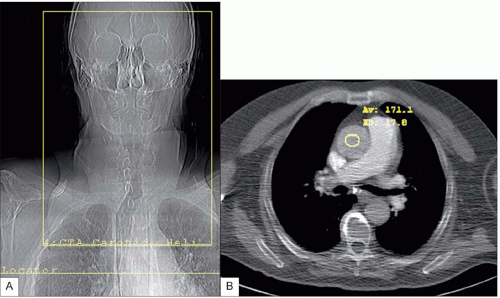
Good vascular imaging can be achieved with a 4-slice MDCT scanner. The acquisition with a 64-slice scanner provides a significant improvement in the imaging because of improved temporal resolution and relative lack of jugular venous superimposition. With a slice thickness of 0.65 mm compared to 1.25 mm with the 4-slice scanner, the spatial resolution is also markedly improved. All scans are triggered from the contrast density in the ascending aorta with the faster 64-slice scanner. With the 4-slice system the scan was triggered from the pulmonary artery in patients under 50 years to ensure the slower scanner did not miss the contrast bolus. The number of technical failures with 64-slice systems is very low.

It is now possible to confirm or exclude vascular disease in any vessel supplying the brain. The time for an experienced radiologist to perform this total assessment is 15-20 minutes which compares favourably with the 30 minutes required for Doppler ultrasound assessment. The issue of radiation dose is not relevant in patients in the age group usually affected. Our dose for MDCTA is actually just a little more than that of our helical head protocol. It is necessary to ensure secure intravenous cannulation to avoid potentially hazardous contrast extravasation.

Previously venous reflux and in-flow contrast venous contamination were problematic and could mask pathology at the root of the neck. This is largely resolved by using smaller volumes of contrast, 60 ml compared to 100 ml, and following that with a large bolus of saline. The right arm is preferred for venous access to minimize artefact from incoming contrast. If the left arm is used, beam hardening artefact from contrast remaining the brachiocephalic vein, which passes anterior to the origins of the great vessels, can destroy details of the vessel origins or cause artefactual stenoses.


Technique


Bolus tracking

This protocol uses 60 ml of contrast (Xenetix 350 or equivalent) injected via dual headed high-pressure pump and flushed with 30 ml saline, both given at 5 ml/sec.

Bolus tracking links the optimal cardiac contrast output to the beginning of data acquisition to ensure best arterial contrast density with minimal venous contamination.

The locator scan for the positioning of the bolus tracking triggering region of interest should be planned approximately 1.5 cm below the carina on the AP surview (8.1A). The locator scan is a 10 mm slice (30 mAs). Table 8.1 presents optimal patient preparation, and the protocol is presented in Table 8.2.


Reconstruction and reformation

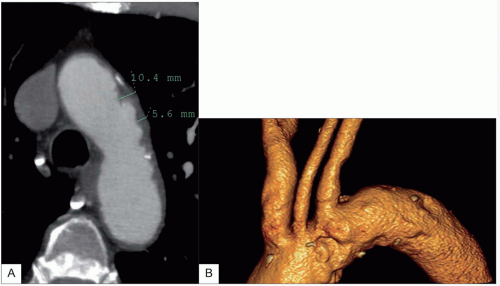
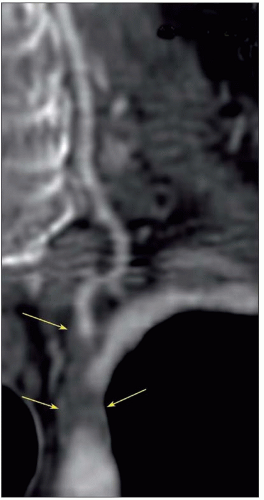
VR3D images provides a rapid overview of the vessels, but base image or MPR review is necessary to measure accurately the degree of stenosis either as a percentage of diameter or, more accurately, the area of the carotid artery.


Pathology and illustrations


Vascular

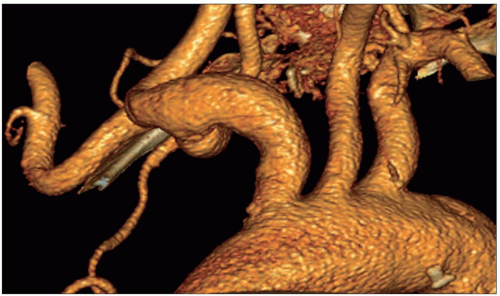
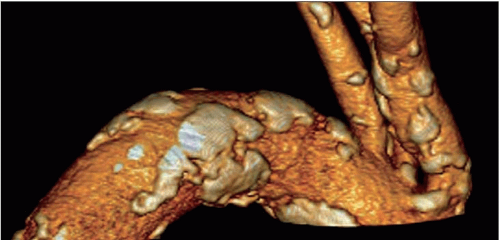
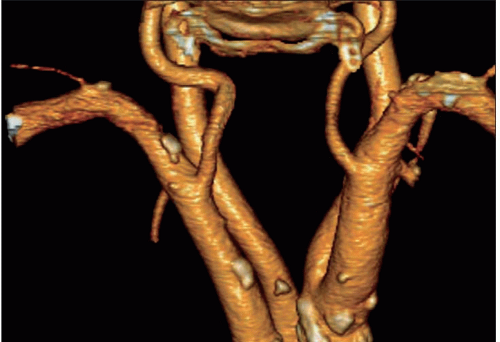
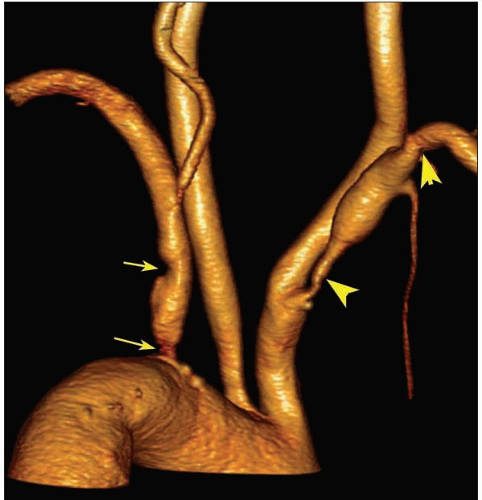
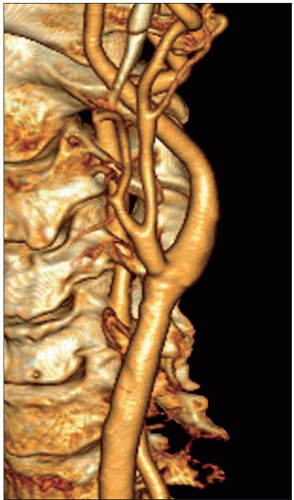
Atheroma is by far the commonest focal causative pathology and is illustrated at many sites.

Dissection:


  • spontaneous


  • traumatic

Vasculitis:


  • large vessel, e.g. aortitis, Takayasu


  • intracranial


Cardiac

Arhythmias, e.g. atrial fibrillation

Right to left shunt, e.g patent foramen ovale

Tumour, e.g. atrial myxoma


Table 8.1 Patient preparation for bolus tracking


  • The patient should be prepared for this examination with an 18 or 20 gauge Venflon in the right cubital fossa


  • The right side is the preferred site of injection for optimum post processing. Injections into the right arm prevent artefact that occurs from the brachiocephalic vein crossing the arch of the aorta


  • The patient should be instructed not to swallow during the clinical scan as movement artifact from this can simulate stenosis around the carotid bifurcation


Table 8.2 Protocol parameters to show aortic arch/great vessel origins, cervical carotid, vertebral arteries, and the Circle of Willis in vascular ischaemic stroke


Patient position


Supine – chin slightly raised


Surview


Anteroposterior from below carina to mid cranium


First slice


1 cm above carina


Last slice


To cover Circle of Willis


Field of view


˜300 mm


Slice width


0.67 mm


Slice increment


0.33 mm


Pitch


0.875


Collimation


64 × 0.625 mm


Rotation time


0.75 sec


kV/mAs


120 kV/400 mAs


Resolution


Standard


Filter


Soft tissue


Reconstructive zoom


As appropriate to show vessel origins


Windowing


WC 60


WW 360


Contrast


Bolus tracking technique is used for this protocol


60 ml at 5 ml/sec


Trigger 150 HU


8.1 (A) Surview for carotid study. The position of the locator can be seen below the carina. Above that is the planned clinical scan. (B) The locator scan showing position of trigger point (150 HU) in the ascending aorta.


8.2 VR image of the aortic arch. This technique for analysing the arch allows assessment within seconds. In this case, the arch and origins of the great vessels are normal.


8.3 This patient has extensive atheroma affecting the arch. The ulcerative soft atheroma in the base image (A) is displayed as the irregular ‘solid’ outer wall of the vessel on the VR3D using the standard filter settings (B). Aortic atheroma in excess of 4 mm is an independent risk factor for cerebrovascular events. This is easily assessed on base images.


8.4 VR3D aortic arch. This patient has gross aortic calcification. This pattern of external calcification is common in diabetic patients. The technique incorporates the calcium on to the surface image and so will hide any underlying pathology. This makes review of the base reconstructions or MPR images essential.


8.5 VR3D of the vertebral artery origins. In this illustration, the lower part of the cervical spine and upper part of the thoracic spine were removed, while retaining the vertebral artery origins which are viewed from behind. In this projection stenoses and calcification are easily visualized. Doppler US is unlikely clearly to define this vascular region.


8.6 VR3D of the subclavian arteries; viewed from behind as in 8.5. This patient has bilateral subclavian stenoses (arrows on left; arrowheads on right) proximal and distal to the vertebral artery origins and this is associated with occlusion of the right vertebral artery. This technique is useful in patients with suspected subclavian steal.


8.7 Curved MPR of the vertebral artery origin. This study, performed on a 4-slice system, is degraded by artefact. Note that the diagnostic quality is not materially affected. The study is sufficient to show a heavy atheroma load (arrows) occluding the proximal subclavian artery extending to involve the vertebral artery origin with subsequent stenosis.


8.8 Assessment of the carotid bifurcations is rapid using a combination of axial images and VR3D images, which help the clinicians appreciate the disease process. This is a nearly normal internal carotid artery – there is only minor irregularity of the vessel, without stenosis.

Only gold members can continue reading. Log In or Register to continue

Stay updated, free articles. Join our Telegram channel

Jul 27, 2016 | Posted by in NEUROLOGY | Comments Off on Vascular Imaging in Ischaemic Stroke and TIA

Full access? Get Clinical Tree

Get Clinical Tree app for offline access