Fig. 30.1
Sequential positions of estimated current dipoles superimposed on an anterior–posterior X-ray image and a schematic representation (black lines) of the spine at the thoracic level. Thick green lines were drawn on pedicles of spines to indicate the lateral boundaries. Left green line traces the sequential movement of the estimated dipoles after stimulation of the right motor cortex. Right yellow line traces the sequential movement of the estimated dipoles after stimulation of the left motor cortex. Middle red line traces the ascending current dipoles after stimulation of the left sciatic nerve
30.2.2 Visualization of Spinal Segment Activity
Tomizawa and colleagues recorded segmental SCEMFs from the dura of the rabbit lumbar spinal cord in response to sciatic nerve stimulation [6]. The distribution of SCEMFs exhibited a quadrupolar pattern propagating from caudal to rostral with short latency. After the conductive magnetic fields passed, stationary dipolar fields appeared and were sustained at several vertebral levels. Thus, in addition to action potential propagation through the fiber tracts, SCEMFs can reveal somal and synaptic activity at multiple spinal cord levels.
30.2.3 Electrophysiological Diagnosis of Conduction Blocks After Spinal Cord Stimulation
In a significant technical leap, Tomori and colleagues visualized spinal cord electrophysiological activity using magnetospinography from the skin surface [7]. They established an incomplete conduction block model using a Fogarty balloon catheter inserted into the epidural space of the cervical spine. Electrical stimuli were applied to the lower thoracic spinal cord with an epidural catheter electrode and SCEMFs were recorded over the skin surface of the neck.
Decreases in conduction velocity and amplitude at the compression site were first detected by spinal cord evoked potentials from the epidural space, confirming the spinal cord lesion. The distribution of magnetic fields showed a characteristic quadrupolar pattern propagating from caudal to rostral. After compression, the amplitude and the conduction velocity of the magnetic fields decreased near the lesion, especially the trailing magnetic fields. These results demonstrate that noninvasive diagnosis of an incomplete conduction block is possible in experimental animals.
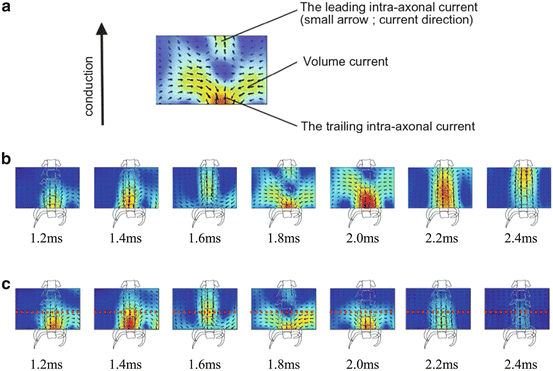
Also in their study, reconstructed electrical current sources were estimated by a novel spatial filter technique . While conventional dipole estimation methods express the electrical currents from nerve activity by one or two representative current dipoles, this special filter technique is able to estimate and visualize electrical activity over the whole measurement area. Using this analytic method, estimated currents were successfully imaged over the cervical spine in response to stimulation of the lower thoracic spine. Moreover, thorough investigation of changes in estimated currents around the lesions showed that current components perpendicular to the long axis of the spinal cord, which correspond to depolarization , and the rostral peak of the trailing component parallel to the long axis stopped and decreased in amplitude at the incomplete block lesion (Fig. 30.2).


Fig. 30.2
(a) Distribution of estimated current sources reconstructed using the spatial filter technique. Small arrows indicate the current direction, and colors represent the current intensity (red > blue). Intra-axonal currents and volume currents are mapped within the measurement area. (b) Distribution of estimated current sources superimposed on a schematic representation of the spine (gray lines) before compression. Electrophysiological activity in the spinal tract, including intra-axonal currents with upward and downward directions and volume currents perpendicular to the spinal cord, propagates from caudal to rostral. (c) Reconstructed currents after compression. The intensity of the leading and trailing intra-axonal currents gradually decreases (2.0 ms) around the compression site (red dots). The decrease in the trailing intra-axonal and volume currents (which correspond to depolarization) is larger than the decrease in the leading intra-axonal current
30.2.4 Electrophysiological Diagnosis of Conduction Block by Peripheral Nerve Stimulation
Sakaki and colleagues measured SCEMFs from the lumbar spinal cord of the incomplete conduction block model in response to sciatic nerve stimulation in rabbits [8]. Again, SCEMFs were attenuated at the lesion. Thus, lesion sites may be localized by peripheral nerve stimulation.
30.3 Visualization of Spinal Cord Electrophysiological Activity in Humans
All procedures followed were in accordance with the ethical standards of the responsible committee on human experimentation and with the Helsinki Declaration of 1975, as revised in 2000 (5). Informed consent was obtained from all patients for being included in the study.
30.3.1 Systems for Magnetospinography
Human SCEMFs must also be measured in a magnetically shielded room . My colleagues and I have developed and evaluated several types of biomagnetometers optimized for human SCEMF recording, including those for measurement in the prone position or sitting position, and have continued to improve them. Our newest SQUID biomagnetometer is a supine position type and its measuring surface is curved to conform to cervical lordosis [9, 10]. A sensor array composed of 40 vector gradiometers positioned in an 8 × 5 matrix covers a 90 mm × 140 mm measurement area. In situ X-ray images of the cervical spine are used to reveal the position of the subject’s spine relative to the SQUID sensors (Fig. 30.3).


