Fig. 28.1
Positioning of a single-voxel in the bilateral posteromedial parietal cortex for study with frontal, sagittal, and axial slices. The area explored includes the posterior cingulate gyrus
To date, the SV is still superior to MV on the grounds of reproducibility [5, 6]. For both SV and MV, the magnetic resonance scanner uses a process known as shimming to narrow peak line widths within the spectra. For SV studies, improving field homogeneity is performed with basic, zero-ordered shimming on clinical magnetic resonance scanners. For MV, the simultaneous production of uniform field homogeneity in multiple regions requires higher order shimming. To obtain high-quality spectra, blood products, air, fat, necrotic areas, cerebrospinal fluid, metal, calcification, and bone should be avoided. In such areas differing magnetic susceptibility results in a non-homogenous field that hinders the production of diagnostic quality spectra.
Two different approaches are generally used for proton spectroscopy of the brain: 1) SV methods based on the stimulated echo acquisition mode (STEAM) and 2) point resolved spectroscopy (PRESS) pulse sequences and spectroscopy imaging, also known as chemical shift imaging. These latter studies are usually done in two dimensions, using a variety of different pulse sequences (spin-echo, usually PRESS). The basic principle underlying SV localization techniques is to use three mutually orthogonal slice selective pulses and design the pulse sequence to collect only the echo signal from the point (voxel) in space where all three slices intersect. The PRESS mode is used more often than STEAM because it increases the signal/noise ratio and is less sensitive to movement artifacts [7].
Echo time (TE) have not yet standardized so far in MRS. In degenerative, demyelinating, and vascular disease a short TE is advocated. A short TE (20–40 ms) allows us to increase the signal/noise ratio and to visualize most metabolite peaks, with the inconvenience of some degree of overlapping of peaks. Intermediate TE (135–144 ms) inverts the lactate peak to better distinguish it from lipids peak. Long TE (270–288 ms) gives worse signal/noise ratio but allows better visualization of some peaks (N-cetylaspartate [NAA], choline [Chow], and creatine [Cr]). Time matters in clinical practice, so short TEs are preferable. In our experience with a 1.5 T General Electric Signa Horizon-clinical scanner a TE of 30 ms and a repetition time of 2500 ms has proven valuable [8].
A TE averaged PRESS technique has been yielding highly simplified spectra with better suppression of signals not pertaining to assessed metabolites, such as that of macromolecules. TE is increased from 35 ms to 355 ms in steps of 2.5 ms with two acquisitions per step [9].
The most commonly used spectroscopy is that originating from a hydrogen nucleus (proton 1H-MRS). This technique is based on the differences in resonance obtained from hydrogen nuclei depending on the surrounding atoms (chemical shift). Each metabolite being assessed discloses a different hydrogen resonance frequency and appears in a different site in the spectrum. The position of the metabolite signal is identified on the horizontal axis by its chemical shift, scaled in units referred to as parts per million (ppm). With the appropriate factors considered, such as the number of protons, relaxation times and so forth, a signal can be converted into a metabolite concentration by measuring the area under the curve. Because water is the main component of living beings and its concentration is much higher than that of metabolites, it becomes necessary to suppress the resonance signal from the hydrogen of water. A plot showing peak amplitudes and frequencies is obtained.
Each spectrum shows peaks corresponding to the different metabolite values: myo-inositol (mI), 3.56 and 4.06 ppm; Chow, 3.23 ppm; Cr, 3.03 and 3.94 ppm; NAA, 2.02; 2.5 and 2.6 ppm; glutamine and glutamate, 2.1–2.55 ppm and 3.8 ppm (See Fig. 28.2). Ratios between metabolites and Cr are also of great value as they counteract the systematic errors of measurements.
Fig. 28.2
A typical in vivo example of linear combination model spectrum in the same area with metabolite peaks. mI: myo-inositol; Chow: Choline compounds; Cr: creatine, Glx: glutamate + glutamine; NAA: N-acetyl-aspartate
A program, called a linear combination (LC) model [10], fits in vivo spectra as a linear superposition of high-resolution “basis” spectra that are acquired from model solutions of the metabolites present in the region of interest. Advantages of an LC model are that all pre-processing steps, automatic phase correction, as well as modelling of a smooth baseline are included. Standardized basis sets are available for the most common clinical magnetic resonance machines (both 1.5 and 3 T).
Evolution of Brain Metabolites over the Lifetime
When analyzing metabolite levels in the whole sample while controlling for age and gender, we observe that all metabolites are correlated with age. NAA, glutamate and glutamate + glutamine and their ratios to Cr show a negative correlation (increase in age with a decrease in metabolite levels and vice versa), while the remaining metabolites, such as mI and Chow, show a direct correlation (See Fig. 28.3). A decrease in glutamate and glutamate + glutamine over one’s lifetime, which is associated with a certain cognitive deterioration, could be expected as significant lower levels of these metabolites are found in AD. There is a certain degree of controversy in the literature regarding the changes in metabolite concentrations and ratios that occur with aging. Estimates of age effects based on such designs are interferred by secular changes in nutrition, medical care, and other factors.
Fig. 28.3
Metabolite levels controlling for age and gender. NAA/Cr (a), Glu/Cr (c) and Glx/Cr (d) ratios show a negative correlation with age, while mI (b) show a direct correlation
MRS in Mild Cognitive Impairment and AD
Altered levels of NAA or NAA/Cr ratios are the most common finding reported in patients with AD and MCI [11–13], although alterations in other metabolites including mI [14] and glutamate [15, 16] are also found. Decreased NAA has been documented in patients with AD. This reduction may reflect a combination of the loss of neural cells, reduced neural metabolism, loss of dendritic structures, and reduced myelination. As NAA is almost entirely located within neurons in the central nervous system, the reduced neuronal density may reflect neuronal death or decreased tissue volume. As the reduced NAA signal could be interpreted as a sign of neuronal dysfunction, it does not necessarily indicate cell death. The depletion of NAA concentration could reflect decreased mitochondrial metabolism, which may correlate with the patient’s age. There are cross-sectional studies dealing with MRS in AD. A study including 206 normal elderly subjects and 121 patients with AD demonstrated a decrease in the NAA/Cr ratios as well as increased mI/Cr and Chow/Cr ratios in the left posterior cingulate gyrus in patients with AD as compared with controls [17]. Some studies suggest a continuum between normal aging, MCI, and AD with regard to the values of NAA in the brain [18, 19].
Longitudinal studies also confirm the utility of MRS as biomarker. The use of spectroscopy in the occipital cortex and posterior cingulated aiming to determine the rate of NAA/Cr, may be a valid tool for predicting the conversion of MCI to AD. It has been demonstrated that receiver operator curve analysis for NAA/Cr <1.61 predicted conversion with 100 % sensitivity and 75 % specificity [20]. The area under the curve was 0.91 with a positive predictive value of 83 % and a negative predictive value of 100 % with 88.7 % correct classification. Similarly [21], it has been shown that NAA/Cr <1.40 in the posterior cingulate predicted conversion of MCI to probable AD with sensitivity of 82 % and specificity of 72 % and an area under the curve of 0.82 and correlates closely with clinical severity scales [22]. Finally [23], showed that NAA/Cr <1.43 in the posteromedial parietal cortex predicted conversion to probable AD with 74 % sensitivity and 84 % specificity and an area under the curve of 0.84.
Additional longitudinal studies showed valuable results with magnetic resonance spectroscopy. In a large cohort of 151 MCI patients (most of them being of amnestic type) followed-up for 3 years, MRS was individually predictive of conversion to dementia but the accuracy of prediction improved when MRS was used in combination with hippocampal volumetry and the presence of cortical infarctions [24].
The value of proton MRS as a biomarker was assessed ante-mortem in a single study with 54 patients ranging from low to high likelihood of having AD and who underwent autopsy. Decreases in NAA/Cr and increases in myo-inositol/Cr ratios in the posterior bilateral cingulate gyrus correlated with higher postmortem Braak neurofibrillary tangle staging [25]. Godbolt and coworkers [26] noted that presymptomatic ApoE 4 subjects had decreased levels of NAA/myo-inositol and NAA/Cr by 10–25 % compared to controls, and that these differences appeared years before clinical symptoms [26]. Kantarci and his group found that the choline/Cr ratios decreased for 13 months in stable patients with MCI, whereas no changes were seen in patients with MCI progressing to AD. This may reflect a compensatory cholinergic mechanism failing in MCI patients who progress to AD [27].
There is also a growing appreciation of common risk factors for AD and vascular dementias (VaD), and that both pathologies may contribute to cognitive decline in an individual. Other primary degenerative dementias, such as fronto-temporal degeneration (FTD) may present atypically. Consequently there may be considerable overlap between clinical and imaging features in these conditions.
Metabolic changes in fronto-temporal dementia are similar to Alzheimer’s disease, with low levels of NAA/Cr and higher than normal levels of myo-inositol/Cr [28]. MRS studies in common dementias are limited to comparing the signs of MRS in Alzheimer’s disease with other dementias such as fronto-temporal dementia [29, 30], vascular dementia and Parkinson disease [31].
It is important to note that the reliability of these values requires a good reproducibility and depends more on the technical characteristics of the study of resonance (magnetic field homogeneity, good signal to noise ratio, peak width of the metabolites) than post-processing methods [32].
Monitoring of Treatment
With the recent availability of many pharmaceutical agents modestly effective for treating symptoms of AD, medicine has entered a new era in treating AD. Neuroimaging may provide a useful tool for monitoring the progression of AD. Several published trials measured the effect of drugs on AD progression with MRS and, we can see in general that drugs produced small changes in metabolite levels and ratios which correlated with the modest clinical or no effect of the drugs on AD progression. Decreases in choline/Cr and choline/phosphocreatine in parietal cortex in comparison with controls have been demonstrated using MRS in patients with AD when receiving xanomeline, a muscarinic agonist [33]. Decreased choline/Cr ratios in patients with AD when treated with cholinergic agonists [34] and increased NAA/Cr were detected under treatment with donepezil, a cholinesterase inhibitor [35].
A randomized trial included 67 patients who were treated with either donepezil or placebo for 1 year [36]. The NAA levels elevated transiently in the donepezil group at week 12 and 18 but the differences were not significant at endpoint, and cognitive improvement correlated with NAA elevations in the cortex. Conversely, in the placebo group the NAA concentration tended to remain near baseline values or to decrease modestly [36]. By comparison, other studies have found only a slight increase of NAA/Cr in patients with AD when treated with rivastigmine [37]. In a randomized trial, donepezil and memantine were compared by analysis of metabolite values in several areas of the brain. The general trend was towards a small elevation of NAA/Cr ratios. However, the results were not statistically significant. In the global sample there was a significant correlation between the clinical changes and changes in NAA/Cr values [38]. A recently published study, including 42 patients with AD and 22 controls all of whom underwent six MRS studies over a 2-year timespan, showed that there is a progressive decline in the NAA/Cr ratios independent of treatment with cholinesterase inhibitors, which is consistent with the lack of efficacy of these drugs [39].
Glutamate is another neurotransmitter studied with MRS. Increased glutamatergic excitotoxicity has been reported in AD but several cross-sectional reports showed decreased levels of glutamate in AD in comparison with controls. In a small open trial, galantamine treatment for 4 months tended to elevate glutamate levels in the hippocampus [40].
Diffusion Tensor Imaging
White Matter Structure
Neuroimaging reveals changes in the white matter (WM) structure in the human brain. WM comprises half of the human brain and consists of bundles of myelinated axons connecting neurons in different brain regions [41]. Grey matter is composed of neuronal cell bodies and dendrites concentrated in the outer layers of the cortex.
Microstructural changes in WM can be revealed by specialized MRI brain imaging techniques such as DTI. This method analyzes the diffusion of protons in tissue, which is more restricted in WM than in grey matter.
DTI Measurement
Water molecules in the brain are in constant Brownian motion, and although the movement of these protons affects conventional structural imaging, diffusion weighted imaging (DWI) and DTI allow quantification of this microscopic movement within each voxel. The main advantage of using diffusion tensor imaging, rather than DWI, is that DTI reflects the underlying diffusion properties of the sample independent of the orientation of the tissue with respect to the direction of measurements (See Fig. 28.4). DTI is thus a robust quantitative technique that is independent of how the subject has been oriented inside the scanner magnet and gradient coils. In regions with few or no constraints imposed by physical boundaries, such as cerebrospinal fluid (CSF) in the ventricles, water movement is random in every direction and is isotropic. In contrast to CSF, the path of a water molecule in a WM fiber is constrained by physical boundaries such as the axon sheath, causing the movement along the long axis of a fiber to be greater than across the radial diffusion. These data can be used to calculate the probable anatomy of WM bundles in living brain, a process called tractography (See Fig. 28.5). Orientation is calculated from the eigenvectors defining proton diffusion in three dimensions in each voxel. Using algorithms, the principal eigenvalue vector is connected to the next voxel to trace the fiber structure and orientation in WM tracts.
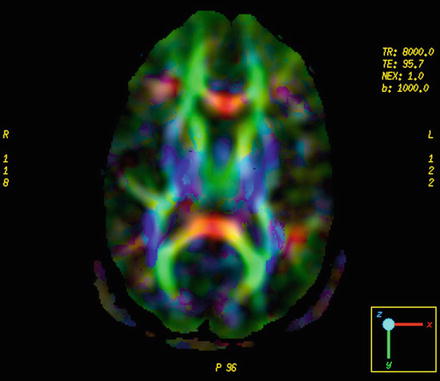
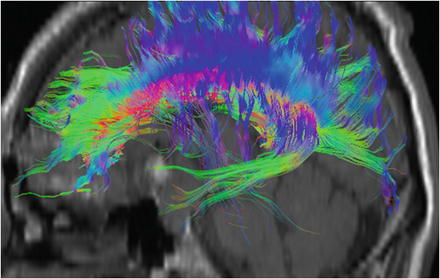
Fig. 28.4
Diffusion tensor imaging and example of color-encoded fiber orientation maps. Fibers that are predominantly oriented left–right are shown in red, anterior–posterior fibers are shown in green, and superior–inferior fibers are shown in blue
Fig. 28.5
3D DTI-based reconstruction results of association fibers in the limbic system (green) and corpus callosum (blue)
DTI yields quantitative measures for tissue water mobility as a function of the direction of water motion and is probed by application of diffusion sensitization gradients in multiple directions. Baser and coworkers [42] described the use of multivariate linear regression to calculate diffusivity, D, from a non-diffusion-weighted image plus six or more diffusion-weighted measurements in a non-collinear direction. The diffusion weighting is obtained by simultaneously applying diffusion gradients along combinations of the three physical axes.
The appropriate mathematical combination of the directional diffusion-weighted images provides quantitative measures of water diffusion for each voxel via the apparent diffusion coefficient (ADC), as well as the degree of diffusion directionality, or anisotropy. The anisotropy increases with increased myelination, diameter, and axon compaction. Myelin is a major diffusion barrier for water, and gives WM its high anisotropy. Demyelinating diseases are characterized by partial or total loss of myelin, with consequent loss of neuronal function.
MCI and AD
Increase in the ADC has been described in multiple regions of WM, corpus callosum, and cingulum of patients with AD as compared with controls [43]. Huang and coworkers [44] found functionally relevant microstructural changes in patients with AD and MCI. These changes were present in brain regions with high cortical functions, but not in regions of primary functions, and are consistent with a hypothetical decrease in axonal process in the temporal lobe [44].
Neuroimaging in MCI and AD generally shows medial temporal lobe atrophy and diminished glucose metabolism in the posterior cingulate gyrus. However, it is unclear whether these abnormalities also impact the cingulum fibers, which connect the medial temporal lobe and the posterior cingulate regions. Assessment of the cingulum fibers using DTI may be of help for an early diagnosis of AD [45].
It was proposed in a recent review that using analysis of regional mean fractional anisotropy (FA) and mean diffusivity (MD) values, it was possible to show that MD values are different in all WM regions of the brain between controls and AD patients, and that FA showed similar results except for the parietal lobe and internal capsule [46]. Furthermore, a few studies in healthy older subjects at risk for AD showed abnormalities in MD values in regions known to be affected in AD [47, 48]. Besides showing early alterations in MCI patients, DTI appears to correlate with cognitive performance independent of cortical atrophy, which suggests access to an upstream process in the neurodegenerative cascade [49]. The search for appropriate DTI and high angular resolution diffusion imaging parameters for the diagnosis of cognitive impairment is still a work in progress [50]. Various parameters behave in different ways according to localization [51]. In addition to the choice of diffusion parameters, recent tractography studies illustrate the superiority of analysis methods that can manage crossing fibers [52].
Perfusion MRI
PET and single-photon emission computed tomography (SPECT) have been used to identify focal changes in regional cerebral blood flow in patients with MCI and AD. However, the low spatial resolution of PET and SPECT, and the ionizing radiation emitted from the nuclear medicine tracers are major concerns. PET imaging offers a variety of techniques that have a significant role in investigating patients with cognitive impairment. Amyloid imaging with [11C]-labeled Pittsburgh compound-B (PIB) amyloid and [18 F]flurodeoxy glucose PET are covered elsewhere. A molecular probe with high affinity to tubulin associated unit fibrils and a low affinity for synthetic amyloid-β1–42 fibrils is in the early phase of development [53].
Magnetic resonance perfusion techniques have also been developed and offer higher spatial resolution without the use of ionizing radiation [54]. Magnetic resonance perfusion techniques are based on exogenous or endogenous tracers. In the method based on exogenous tracers, a paramagnetic agent such as gadolinium dimeglumine gadopentate is injected, and the resulting decrease and subsequent recovery of the magnetic resonance signal is used to estimate perfusion (See Fig. 28.6). In the method using endogenous tracers, the magnetization of the spins of arterial water are noninvasively labeled using radiofrequency pulses, and the regional accumulation of the label is measured in the tissues by comparison with an image acquired without labeling. In the case of ASL, there is no need to use exogenous contrast material; it uses endogenous water magnetization as diffusible tracer and works with modifications of the magnetization state of blood [55]. Arterial spin labeling-MRI studies of patients with AD and MCI have reported a similar pattern of regional hypoperfusion to that described in previous PET and SPECT studies. Moreover, arterial spin labeling-MRI offers several advantages over PET and SPECT: (1) it is free of exposure to ionizing radiation, intravenous contrast agents, and radioactive isotopes; and (2) it can be rapidly repeated because labeled water is cleared after a few seconds. An additional advantage is that perfusion and structural images can be acquired at the same imaging session.
Fig. 28.6
Example of cerebral perfusion contrast-enhanced dynamic susceptibility. (DSC) with decreased left frontal cerebral blood
Previous studies using this method have shown hypoperfusion in some brain areas in patients with MCI and AD compared with controls, including the right inferior parietal, bilateral posterior cingulate gyri, and bilateral middle frontal gyri, a pattern of hypoperfusion that is similar to the one seen with PET and SPECT scan studies in this population [56, 57]. Chao and coworkers [58] compared the predictive value of cerebral perfusion as measured by arterial spin labeling-MRI with magnetic MRI hippocampal volume for determining future cognitive and functional decline and subsequent conversion from MCI to dementia [58]. Results from linear mixed effects modeling suggest that baseline perfusion from the right precuneus predicted subsequent declines in the Clinical Dementia Rating, Functional Activities Questionnaire, and selective attention, whereas baseline hypoperfusion in the right middle frontal cortex predicted subsequent episodic memory decline in the California Verbal Learning Test. These results suggest that hypoperfusion as detected by arterial spin labeling-MRI can predict subsequent clinical, functional, and cognitive decline and may be useful in identifying candidates for future AD treatment trials.
Structural Neuroimaging
Structural neuroimaging has also been validated as a tool in the detection and progression monitoring of preclinical AD. In AD there is cortical atrophy including thinning of gyri, widening of sulci, thinning of the cortical ribbon (coronal plane), reduced volume of the centrum semiovale, and lateral ventricular enlargement (one third of cases). The atrophy is evident in the medial temporal lobe, particularly the amygdala, hippocampus, and parahippocampal gyrus. Temporal lobe MRI may have an important role in assisting with the clinical diagnosis of AD, particularly its differentiation from other disorders that may cause diagnostic difficulties in the clinical practice. Tissue volumes in the central nervous system, and in particular changes in volume over time, are sensitive markers of a range of neurological disease states and disease progression. Measurement of brain volume requires segmentation of the brain from the rest of the tissues in the head and neck. While this can be performed manually or in a semiautomated manner, automated procedures are likely to be more reproducible and rapid. This is understandable because the size of the structures involved is usually relatively small, making the analysis less tedious than a manual segmentation of the whole brain. Manual segmentation to measure the hippocampal volume is recognized as the gold standard. However, an initial survey of the 12 most cited manual segmentation protocols revealed a 2.5-fold volume measurement difference [59]. The group that included Barnes performed a meta-analysis of hippocampal atrophy rates in patients with AD and matched controls from studies reported in the peer-reviewed literature [60]. Meta-analysis and meta-regression were then performed with nine studies from seven centers, a total of 595 patients with AD and 212 matched controls. They found strong evidence of between-study heterogeneity, and finally concluded that the overall hippocampal atrophy rate was 1.4 % in normal controls with an age range of between 69 and 83 years. In patients with AD, the overall atrophy rate was 4.6 %. Automated validated measures of hippocampal volume will help to increase reproducibility of results. Additionally, many structures such as the hippocampus, are difficult to segment in an automated manner, but are relatively easily identified and manually or semiautomatically outlined, given the appropriate software. Some progress has been made in automating segmentation procedures, with methods including the use of deformable shape models.
Related posts:
 Towards a Psychotherapy with a Philosophical Basis
Neurosciences, Neuroeconomics, and Metaphysics
Role of the Neuropeptide Angiotensin II in Stress and Related Disorders
Animal Models of Psychopathology and Its Relation to Clinical Practice
Adenosine in the Neurobiology of Schizophrenia: Potential Adenosine Receptor-Based Pharmacotherapy
Towards a Psychotherapy with a Philosophical Basis
Neurosciences, Neuroeconomics, and Metaphysics
Role of the Neuropeptide Angiotensin II in Stress and Related Disorders
Animal Models of Psychopathology and Its Relation to Clinical Practice
Adenosine in the Neurobiology of Schizophrenia: Potential Adenosine Receptor-Based Pharmacotherapy
 Attentional Capacity in Children: Intervention Programs for Its Development
Stay updated, free articles. Join our Telegram channel

Full access? Get Clinical Tree


