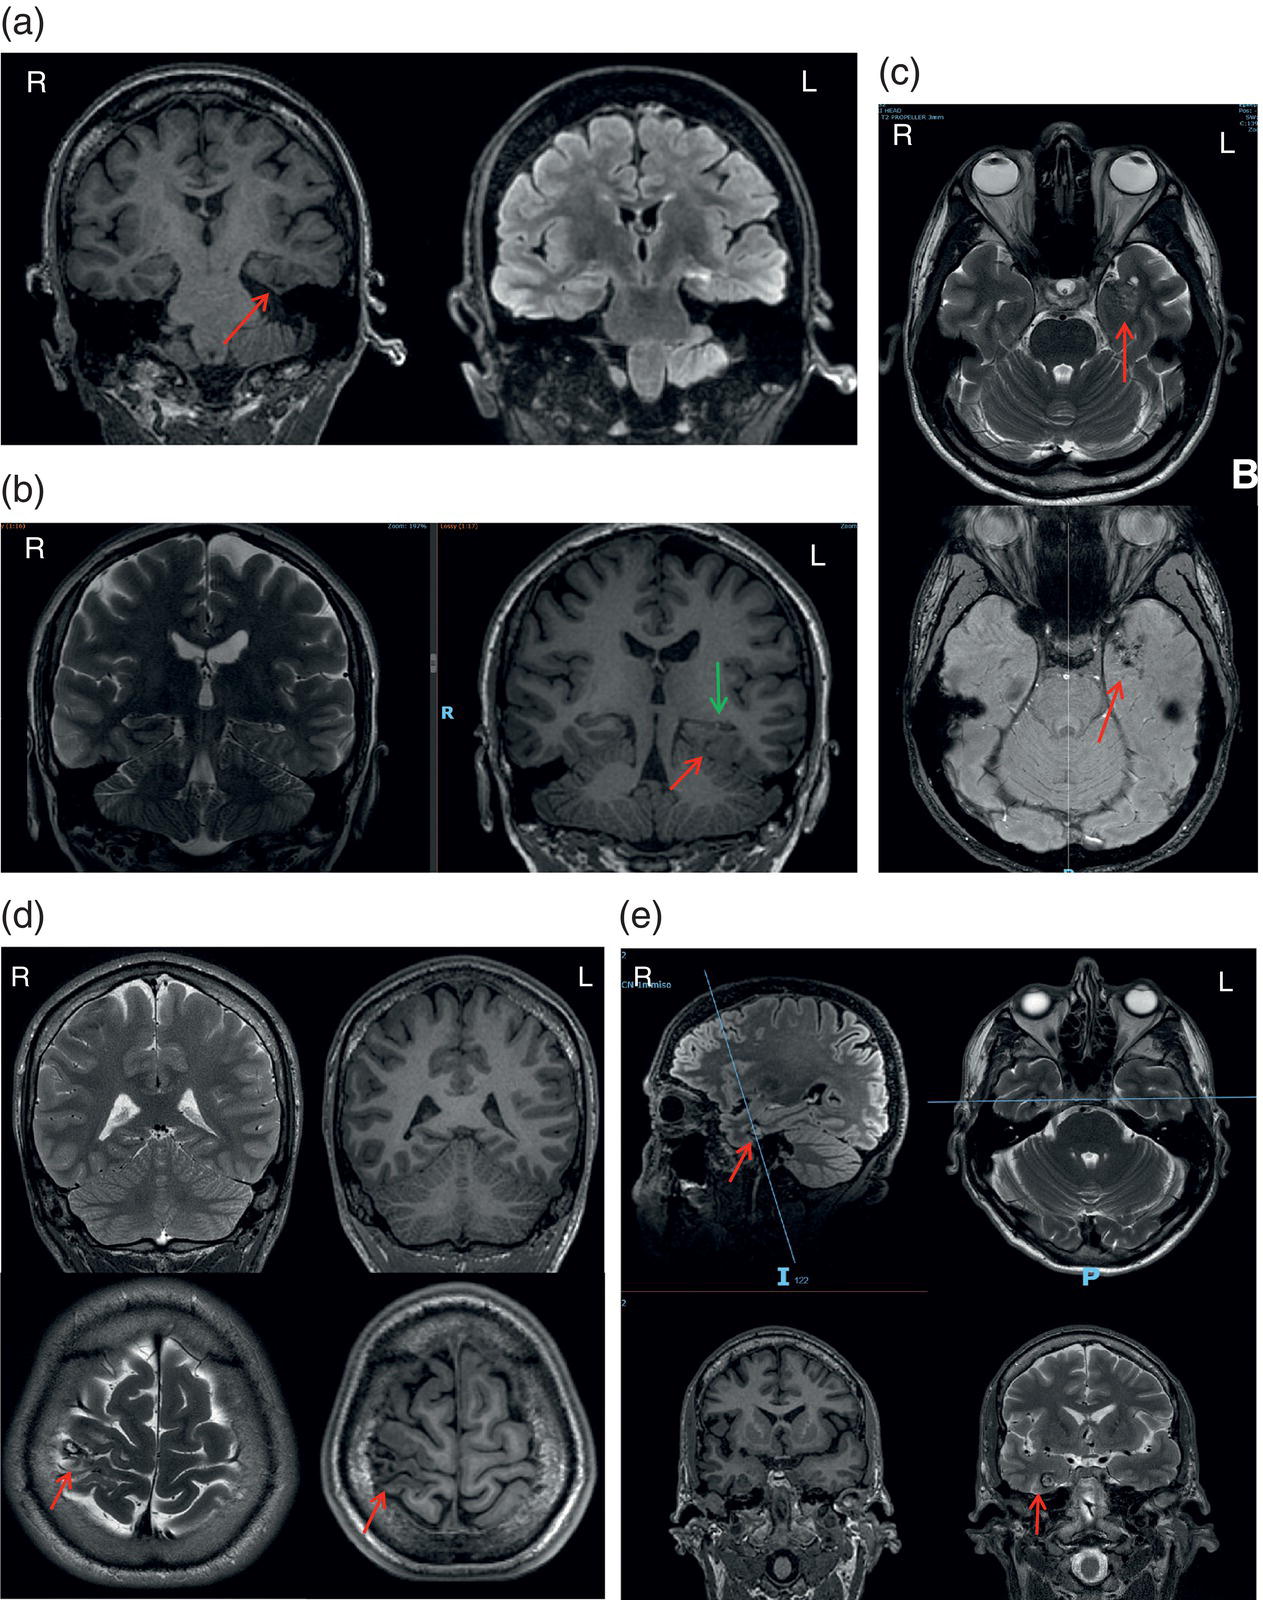
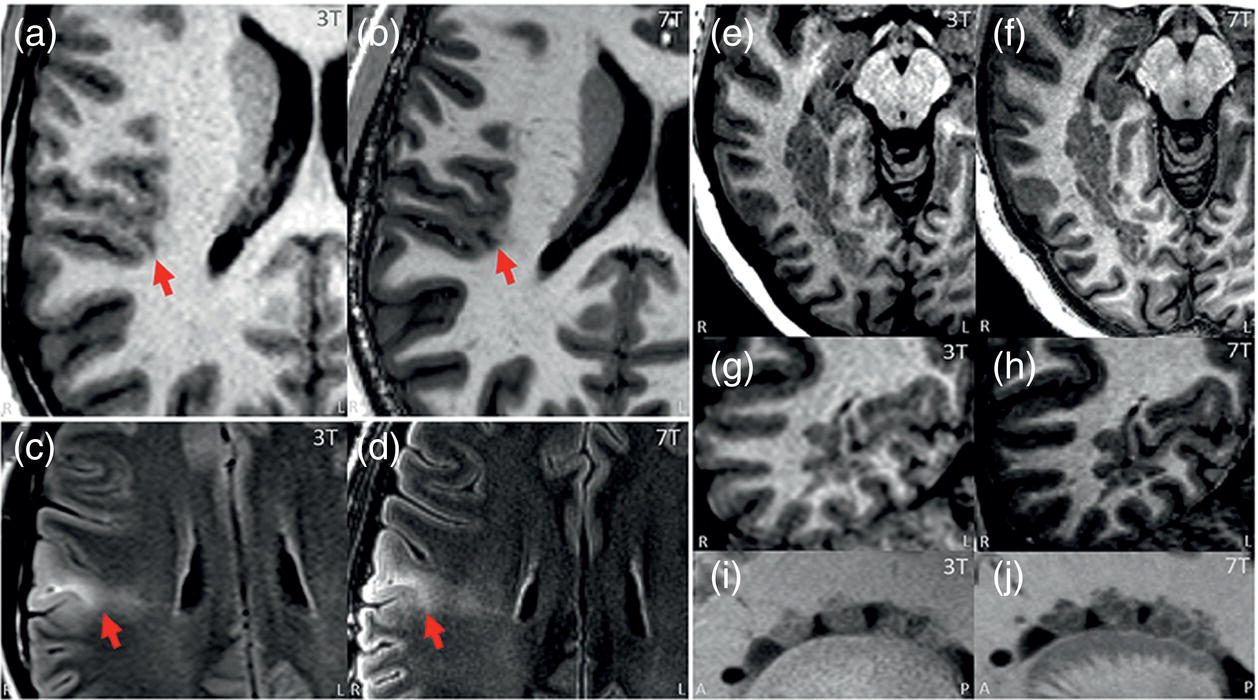
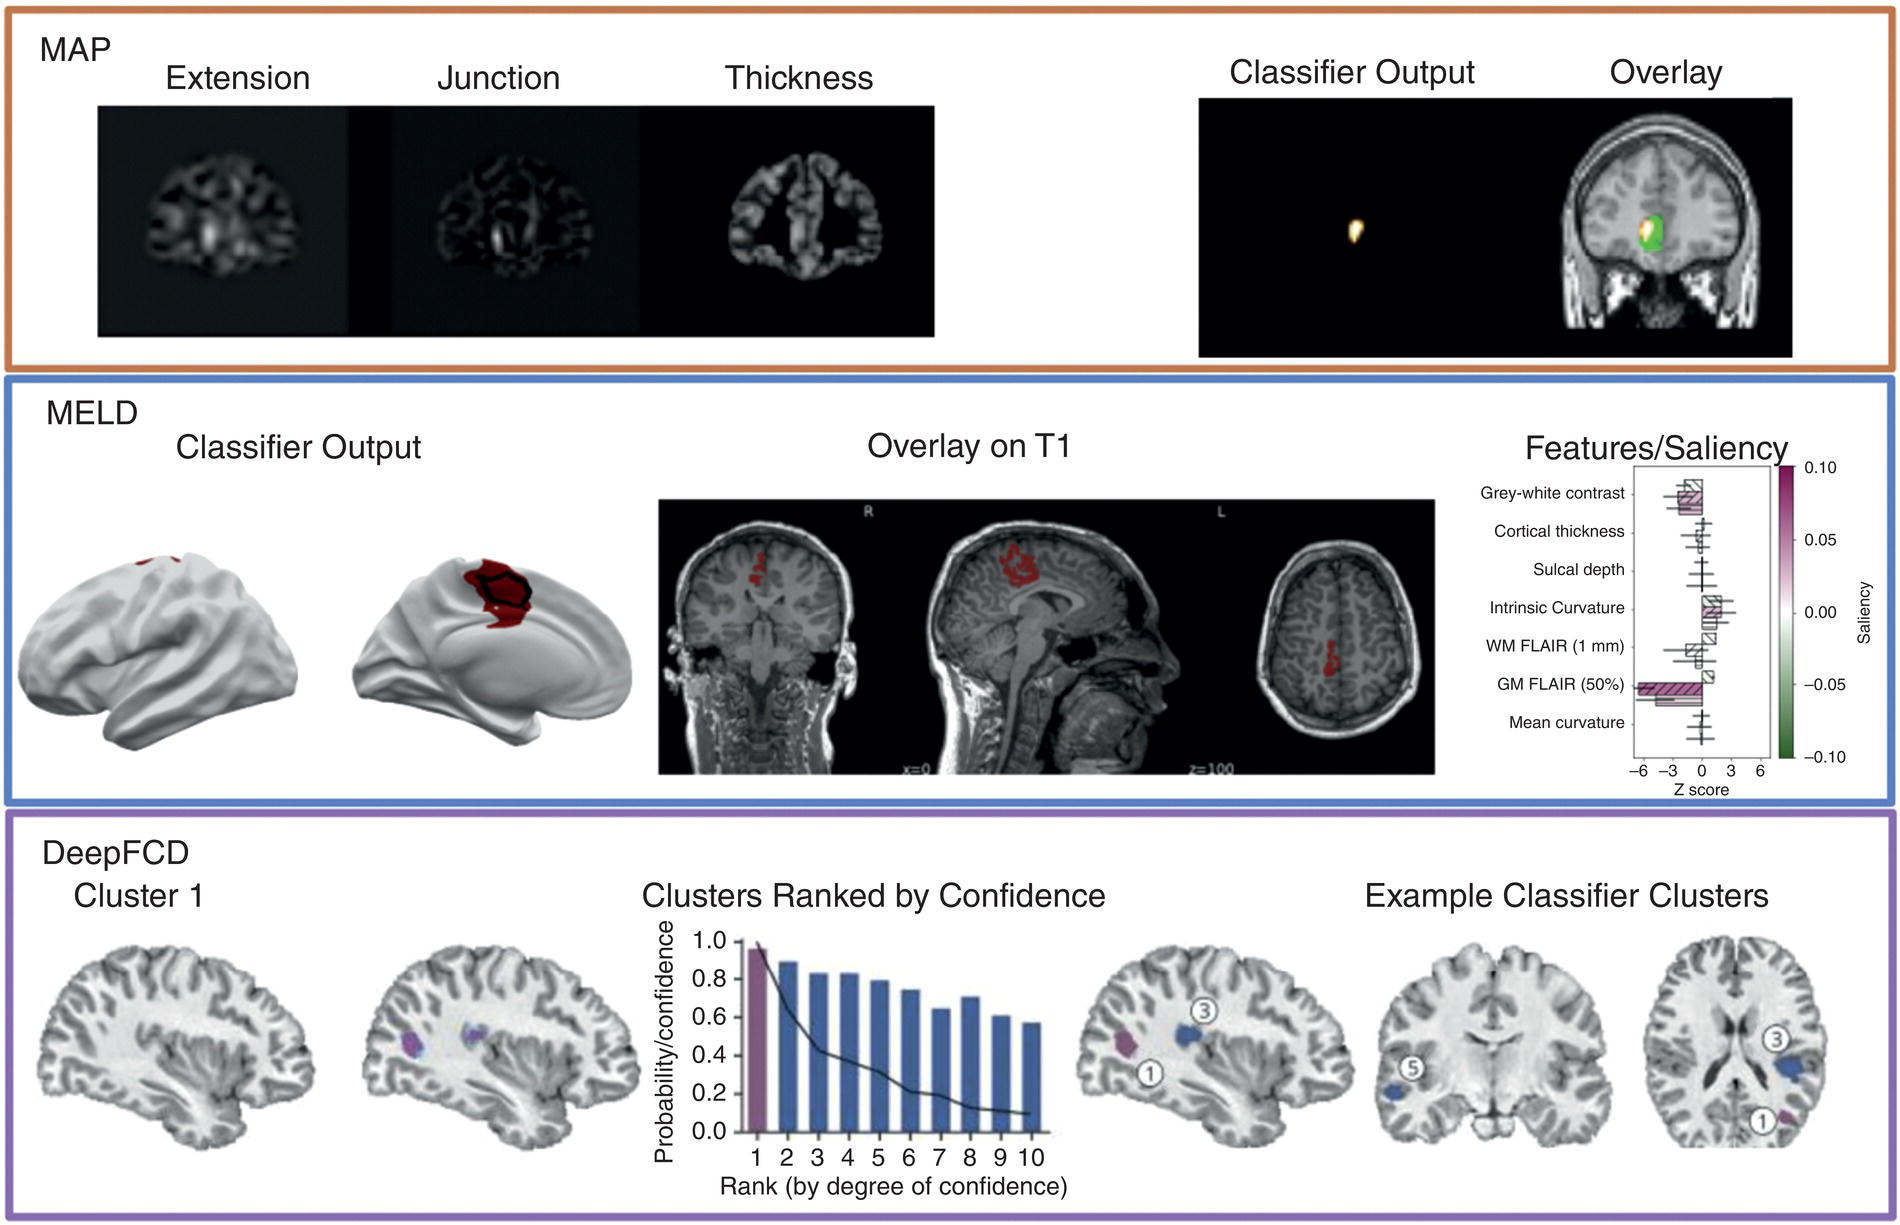
Meneka K. Sidhu, Matthias J. Koepp, and John S. Duncan Good quality magnetic resonance imaging (MRI) is fundamental to diagnosing the reasons for someone’s epilepsy, and for identifying cerebral comorbidities and the consequences of epilepsy. Advances in qualitative and quantitative MRI, along with post‐processing and multimodal procedures, have improved the detection and characterisation of subtle or ambiguous epileptogenic lesions. In the long term, 40–50% of people with temporal lobe epilepsy (TLE) are rendered seizure‐free with epilepsy surgery.1 The principal lesions that are looked for in individuals with drug‐resistant epilepsy (DRE) are those that are potentially surgically treatable: hippocampal sclerosis (HS), focal cortical dysplasia (FCD), low‐grade tumours, cavernomas, arteriovenous malformations and focal traumatic damage. See Chapter 15, Epilepsy surgery. High‐quality MRI is also essential for identifying pathologies that merit specific treatment in their own right, such as vascular disease, tumours, infections, infestations, and autoimmune conditions. MRI is also essential for guiding genetic testing, such as in tuberous sclerosis and lissencephaly, as well as for serial studies to identify lesion progression, such as in meningiomas. Additionally, it is used to identify and characterise the consequences of epilepsy, including cerebral atrophy. See Chapter 22, Neurodegeneration. Besides identifying structural lesions, a key role of MRI is to avoid harm by identifying and visualising eloquent functions and critical white matter tracts, to mitigate the collateral damage of neurosurgical treatment. Functional MRI (fMRI) can broadly localise eloquent functions of language, memory, motor, sensory and visual functions. Tractography, derived from diffusion MRI, can infer the location of the main white matter tracts. Individual 3‐Dimensional multimodal imaging is used on surgical navigation platforms such as EpiNav to plan strategies for surgical resection as well as trajectories for intracranial EEG studies. See Chapter 15, Epilepsy surgery. The standard protocol for epilepsy‐specific structural imaging is based on a balance between diagnostic accuracy and clinical feasibility. This protocol includes 3‐Dimensional 1mm3 isotropic voxel volumetric T1 weighted imaging, axial and coronal T2 weighted and FLAIR sequences, and axial T2* gradient echo (GRE) or susceptibility‐weighted sequences to identify vascular and calcified lesions (Figures 8.1, 8.2).2,3 FIGURE 8.1 (a) Left hippocampal sclerosis with atrophy and increased FLAIR signal, and mild left lateral ventricle dilatation. (b) Left hippocampal sclerosis (green arrow) and focal cortical dysplasia (red arrow) with left temporal white matter signal abnormality and blurring of the grey‐white matter junction involving the temporal pole, inferior temporal, fusiform and parahippocampal gyri. (c) Arteriovenous malformation with heterogeneous signal intensity on T2 sequences (upper panel) with cyst‐like areas in the anterior and lateral aspects of the lesion, with minimal mass‐effect in the left temporal horn, and increased susceptibility on SWI (lower panel) reflecting focal calcification. (d) Heterogeneous cortical and subcortical lesion, likely dysembryoplastic neuroepithelial tumour, centred on the right central sulcus. (e) Cavernoma centred on the anterior aspect of the right fusiform gyrus, just adjacent to the collateral sulcus. No internal signal alteration or surrounding oedema to suggest recent haemorrhage. FIGURE 8.2 Paired 3 T–7 T Images of focal cortical dysplasia (FCD) IIB showing similar lesion presence, but improved lesion conspicuity and improved boundary definition. (a) Images from T1w MPRAGE sequence from 3 T with arrow pinpointing the lesion. (b) Images from T1w MP2RAGE sequence from 7 T at the same location, with arrow pinpointing the lesion. (c,d) Paired 3 T–7 T Images of FCD IIB showing similar lesion presence, improved lesion conspicuity and improved boundary definition. (c) Images from T2w axial FLAIR sequence from 3 T with arrow pinpointing the lesion. (d) Images from T2w axial FLAIR sequence from 7 T at the same location, with arrow pinpointing the lesion. (e–j) Paired 3 T–7 T Images showing nodular heterotopia with similar lesion presence, improved lesion conspicuity and improved boundary definition. (e,g,i) Images from T1w MPRAGE sequence from 3 T showing the lesion. (f,h,j) Images from T1w MP2RAGE sequences from 7 T at the same location. (e,f) Axial zoomed. (g,h) coronal zoomed. (i,j) sagittal zoomed. Source: Wang IZ, et al.2/Frontiers Media S.A./CC BY 4.0. The current clinical gold standard for MRI scanners in high‐income countries is with 3 Tesla magnets. MRI acquired at 7 T can give higher spatial resolution and improved detection of subtle lesions. Compared to 1.5 T MRI, there was an 18% improvement in lesion detection rate at 3 T and a 23% improvement from 3 T to 7 T. At present, the availability of 7 T MRI is limited, and artefacts present considerable problems. A key current focus is to develop acquisition and processing routines that mitigate this issue and enable wider clinical application. At the other end of the spectrum, low‐ and middle‐income countries, lacking reliable electricity supplies and logistics, are poorly equipped with MRI. A low field strength (0.064 T) portable MRI with AI‐enhanced image processing potentially offers a cost‐effective solution to this issue. Whilst MRI is superior in terms of spatial resolution, sensitivity and precision in the evaluation of individuals with epilepsy, X‐ray CT still has an important role. Particularly in the acute situation of the Emergency Department, X‐ray CT is useful in determining whether there is an acute intracerebral lesion or traumatic damage. X‐ray CT can also be useful for individuals with implants and devices that are not MRI‐compatible, to clarify the presence of calcification. X‐ray CT is also helpful to define abnormalities of skull anatomy, such as bony defects in the middle cranial fossa associated with temporal meningoencephaloceles. Methods for improving qualitative imaging include higher‐field imaging and the development of novel MRI sequences. Increased spatial resolution yields a greater signal‐to‐noise ratio, enabling more accurate subfield analysis of mesial temporal structures and the detection of previously unidentified migration abnormalities. In MR negative focal epilepsy at 1.5 and 3 T, GRE and FLAIR sequences at 7 T identified previously undetected HS and FCD in a third of cases. Apart from higher field imaging, novel contrasts such as double inversion recovery, in which CSF and white matter signals are suppressed, and arterial spin labelling can increase the yield of FCD detection. Quantitative Susceptibility Mapping (QSM) can identify and quantify magnetic susceptibility variations associated with different tissue properties. QSM offers better contrast compared to conventional susceptibility‐weighted imaging (SWI) for differentiating calcifications (diamagnetic) from haemosiderin or iron deposits (paramagnetic). In epilepsy, QSM is particularly helpful in detecting lesions with calcification, for example, those associated with tuberous sclerosis or dysplasia, haemosiderin or microbleeds, iron accumulation, and vascular lesions such as cavernous malformations. QSM is valuable for distinguishing between calcified lesions and microbleeds, as well as between iron deposition or gliosis in HS, which may influence surgical decisions.4,5 Whilst QSM shows promise, it is sensitive to motion and air‐tissue interfaces, which can lead to image distortion. In people with epilepsy, diffusion‐weighted imaging helps clarify the presence of ischaemia and infection, as well as the nature of oedema. Measures of anisotropy and diffusion are used in population studies to infer the consequences of epilepsy. See Chapter 22, Neurodegeneration. Tractography is used to visualise critical cerebral tracts, such as the corticospinal tract, optic radiation, and arcuate fasciculus, for precise surgical planning. See Chapter 15, Epilepsy Surgery. Magnetic resonance spectroscopy (MRS) in epilepsy plays a key role in complementing structural and functional imaging, identifying biochemical changes that are not visible with conventional MRI. MRS measures metabolite concentrations in specific brain regions, providing insight into epilepsy pathophysiology. N‐Acetylaspartate (NAA) is a marker of neuronal integrity, and decreased NAA is often seen in epileptogenic zones, suggesting neuronal dysfunction, which may help detect subtle FCD or HS. Elevated choline is often seen in epileptic foci. Creatine plays a crucial role in energy metabolism, and alterations in its levels can suggest metabolic disturbances. Lactate indicates anaerobic metabolism, often associated with ictal activity or hypoxia. Abnormal levels of glutamate and GABA are possible indicators of neurotransmission imbalances. MRS at 7 T provides higher resolution and sensitivity, improving the detection of subtle metabolic changes in smaller brain regions. Glutamate Chemical Exchange Saturation Transfer (GluCEST) imaging at 7 T showed increased levels of glutamate in hippocampi and subiculum, ipsilateral to seizure onset in temporal lobe epilepsy (TLE) with no structural lesions.6 Longitudinal MRS has also been used to track disease progression and treatment effects, such as metabolic normalisation with ASMs or after surgery.7 Research is exploring how MRS could be used during seizures to investigate dynamic changes in metabolites such as lactate and glutamate. In approximately one‐third of people with focal DRE, the MRI is unremarkable.8 A focus of computational neuroimaging is to visualise covert structural brain lesions underlying focal epilepsies. Focal cortical dysplasia and HS are the most common identified pathologies in surgical series9 and these may not be evident on current MRI. A current goal is to visualise covert FCD and HS, as identifying such focal abnormalities can significantly impact the consideration of surgery. Features commonly associated with HS on qualitative structural imaging include atrophy and hypointensity on T1‐weighted scans, as well as increased T2 Signal and architectural disruption, assessed on T2‐weighted images. Quantifying hippocampal volumes and T2 relaxometry values through automated segmentation has improved the diagnostic sensitivity of HS and assessed hippocampal integrity. Characteristic features of FCD on T1‐weighted MRI are increased cortical thickness, blurring of the grey‐white interface and folding abnormalities. FLAIR may show increased signal, particularly the transmantle sign extending from the cortex to the ventricles, characteristic of FCD Type IIB. Voxel and surface‐based approaches have been used to extract features characteristic of FCD. Machine learning has enabled the identification of complex patterns in these features.10 Deep‐learning from T1 and FLAIR MRI data has also been used to detect FCDs automatically.11 Morphometric Analysis Programme (MAP) is a voxel‐based programme utilising Statistical Parametric Mapping (SPM). The T1‐weighted MRI of an individual is compared against a normal database to identify areas of grey‐white matter blurring, abnormal extension of grey matter into white matter and increased cortical thickness. Using MP2RAGE data with improved B1‐homogeneity, FCD was detected with 97% sensitivity and 34% specificity (Figure 8.3).13 The Multi‐Centre Epilepsy Lesion Detection (MELD) algorithm for detecting FCD employs a surface‐based approach. The input data is T1‐weighted MRI, with the option to add FLAIR data. Many thousands of vertices are fitted to the grey‐white matter boundary and pial surfaces with FreeSurfer. Features, such as cortical thickness, blurring of the grey‐white matter boundary, curvature, sulcal depth and FLAIR intensities are estimated at each vertex. These are then used to train a multi‐layer perceptron to segment FCDs, with the recent addition of a graphic convolutional neural network. The sensitivity to detect FCDs was 72%, and specificity 60% (Figure 8.3).12 DeepFCD is a deep‐learning algorithm trained to segment FCD from 3D T1 and FLAIR MRI.11 Scans are subdivided into 16x16x16 voxel patches. Convolutional neural networks are trained to classify whether each patch is part of the lesion, and predictions are then recombined into a prediction volume. There was a 93% sensitivity and 90% specificity, with a median of 6 additional false‐positive clusters per individual (Figure 8.3). Automated hippocampal volumetry, morphometry and T2 measurements, compared with normal data, increase the detection of subtle, focal and bilateral HS and can be accessed at (http://niftyweb.cs.ucl.ac.uk/).14 The inclusion of surface‐based features has enhanced hippocampal morphometry with an improved detection of HS.15 It is anticipated that, soon, AI‐based algorithms will have matured considerably and will reliably detect covert cortical lesions associated with focal DRE, including low‐grade tumours, gliosis, and vascular pathologies. When applying these methods to individuals, it is essential to consider the balance between sensitivity and specificity, as well as the alignment of imaging findings with clinical and neurophysiological data. FIGURE 8.3 Outputs from MAP, MELD and DeepFCD FCD detection programmes. Source: Adler et al. (2025)/ Springer Nature, 12 showing focal computational abnormalities on T1‐weighted MRI suggestive of focal cortical dysplasia.
CHAPTER 8
Neuroimaging
MR IMAGING
MRI FIELD STRENGTH
MRI VS X‐RAY COMPUTED TOMOGRAPHY
QUALITATIVE ADVANCES IN MRI
EMERGING TECHNIQUES
QUANTITATIVE SUSCEPTIBILITY MAPPING
DIFFUSION‐WEIGHTED IMAGING
MAGNETIC RESONANCE SPECTROSCOPY
QUANTITATIVE COMPUTATIONAL IMAGING
Related posts:



Stay updated, free articles. Join our Telegram channel

Full access? Get Clinical Tree


