Fig. 1
a Detailed 3 s electroencephalographic records with specific features visible during certain sleep stages in humans with (from top to bottom), Beta-activity during active waking, alpha activity during waking with eyes closed, theta activity during NREM sleep stage 1, K-complex and spindle activity (12–15 Hz) during stage 2, and delta activity during stage 3. b Schematic hypnogram of a normal human night sleep, with waking, the three NREM sleep states and REM sleep. Note the predominance of deep NREM sleep (NREM3) with high amplitude slow-waves at the beginning of the night and the long REM sleep episodes at the end of the night
Modern day PSG in humans combines the recording of the EEG with recording of muscle activity (electromyography, EMG), eye movements (electrooculography, EOG), heart rate (electrocardiogram, ECG), and respiration, but the EEG remains the backbone of sleep research in humans. Since the end of the 1960s, sleep staging in humans was mainly done according to the definitions of Rechtschaffen and Kales (1968) with one waking state, four NREM sleep states, and REM sleep. In 2007, the American Academy of Sleep Medicine (AASM) published a manual with new recommendations for recording methods and terminology (Iber et al. 2007). In this manual, the deep states of NREM sleep (states 3 and 4) are lumped together in one NREM sleep state (state 3 or slow-wave sleep; SWS). In addition, the manual contains rules for arousal, cardiac, movement, and respiratory events which add value to the clinical assessment of sleep disturbances and sleep-related illnesses. However, the specifications given by the AASM for recording and scoring of normal healthy sleep are not without controversy (Danker-Hopfe et al. 2009; Miano et al. 2010; Moser et al. 2009; Novelli et al. 2010). With these specifications for sleep state scoring it is possible to provide a record of the sleep-wake architecture over an entire night (Fig. 1b).
In other mammals and birds, in general, three states (waking, NREM sleep , and REM sleep) are distinguished. In Fig. 2, examples are given for EEG and EMG recordings in a mouse for the three vigilance states. With the electrode placement in mice, as described previously (Deboer et al. 2007b, 2013; Huber et al. 2000a), the EEG predominantly shows theta activity (~ 7 Hz) during waking and REM sleep, whereas in NREM sleep, high amplitude slow-waves (< 5 Hz) predominate. During sleep EMG levels are low, whereas during waking EMG activity is higher. In some animal studies, NREM sleep is divided into deep NREM sleep, with high amplitude slow-waves and light NREM sleep with a lower EEG amplitude. In studies interested in REM sleep regulation or REM sleep-related phenomena, an intermediate or transitional state between NREM and REM sleep may be identified (Deboer et al. 1998; Gottesmann 1996). Although the vigilance states waking, NREM sleep, and REM sleep show large similarities in their behavior between mammalian species, the EEG and its spectral composition (Fig. 2, right panels) may differ (compare for instance human EEG (Borbely et al. 1981) with rat EEG (Borbely et al. 1984)). The latter may be due to differences between species in brain anatomy, but also because electrodes may not always be positioned at similar anatomical sites of the different species.
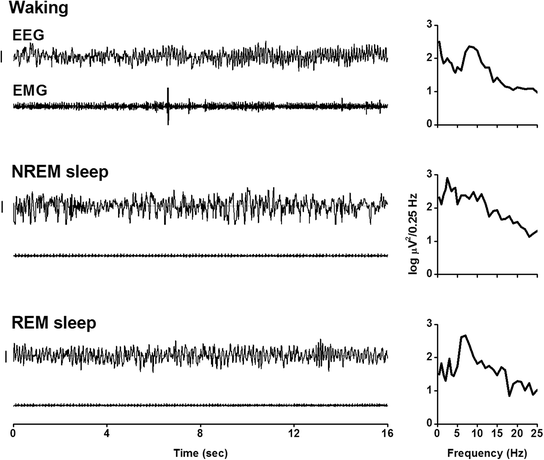
Fig. 2
Left panelsDetailed electroencephalogram (EEG) and electromyogram (EMG) traces of 16 s of a mouse. Classification of the vigilance states is based on the visual inspection of both signals. Note the low activity, with heart rate, in the EMG in both sleep states. During waking, EMG activity is high and the EEG shows high theta (~7 Hz) activity. Right panels Spectral analysis of the corresponding EEG traces in the left panel by a fast Fourier Transform routine. Spectral analysis is a mathematical approach to quantify the composition of complex waveforms with the purpose to decompose the complex signal into its single frequency components. Applied to the EEG it provides the opportunity to not just recognize the different vigilance states and the corresponding dominant frequencies in the EEG (left panels, and Fig. 1) but the whole spectral composition of the EEG (right panels). Indicated is the average power density spectrum of the four 4-s epochs in the left panel in 30 frequency bins between 0.25 and 25 Hz plotted on a logarithmic scale. The slow-waves during NREM sleep are reflected by high activity in the delta band (below 4 Hz). REM sleep and waking are characterized by dominant activity in the theta band (5.25–7.0 Hz)
2 Sleep Homeostasis
2.1 Homeostasis of Sleep Behavior
As mentioned previously, sleep as a behavior can be distinguished from other similar states like coma, hibernation , and death through different sleep specific features. In addition, some kind of regulatory capacity to sleep can be observed. When sleep is lost, this loss is, at least partly, compensated by extending and/or deepening subsequent sleep. This homeostatic aspect is thought to be one of the main regulatory processes in sleep and seems to be universal, as it is found in many different phyla of the animal kingdom. For instance, in many invertebrate species, like cockroaches, drosophila, bees, and scorpions an increase in rest was observed after rest deprivation, suggesting compensation after sleep loss (Hendricks et al. 2000; Sauer et al. 2004; Shaw et al. 2000; Tobler and Neuner-Jehle 1992; Tobler and Stalder 1988). In birds similar observation of increased sleep after sleep loss was done (Bobbo et al. 2008; Boerema et al. 2003; Tobler and Borbely 1988). Figure 3 illustrates this homeostatic response in a mammal. It shows the average hourly values of NREM sleep and REM sleep in a group of rats during a baseline day, and during and after they are subjected to a 6 h sleep deprivation. In the hours following the sleep deprivation, both NREM sleep and REM sleep values are enhanced above corresponding baseline levels. Similar data are obtained in different sleep laboratories with several different sleep deprivation and recording methods in different species, vertebrate, and invertebrate [for some other examples see (Deboer et al. 1994; Franken et al. 1991a; Hasan et al. 2012; Huber et al. 2000a, b; Shaw 2003)]. In monophasic sleeping species, like humans, the amount of sleep per hour is usually not much increased after sleep deprivation, but sleep is significantly extended. Despite this difference, all species show the same phenomenon of increased sleep. Another similarity between species is that the recovery of the amount of sleep is not complete. In the example in Fig. 3, the panels on the right show the amount of NREM sleep and REM sleep lost and regained during the 6-h sleep deprivation and subsequent 18-h recovery. Due to the sleep deprivation, the animals lose, on average, almost 200 min of NREM sleep and 50 min of REM sleep, but they do not regain this loss in the subsequent recovery. In the course of the dark period, the animals still lack 100 min of NREM sleep and 10–15 min of REM sleep, which is not recovered. If there is a sleep homeostatic response it does not involve complete homeostasis of the amount of sleep. Either it is incomplete homeostasis or there must be other ways of recovery instead.
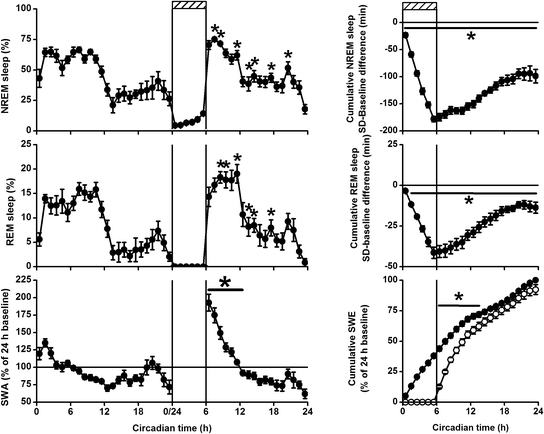
Fig. 3
Left panels Time course of 48 h of non-rapid eye movement (NREM) sleep, REM sleep, and slow-wave activity (SWA; EEG power density between 1 and 4 Hz) in NREM sleep across a baseline day, during a sleep deprivation performed during the first 6 h of the rest period (hatched bar at the top), and 18-h recovery in 1-h mean values (± SEM, n = 11). The recordings were obtained after 7 days adaptation to constant darkness. The vigilance states are expressed as a percentage of total recording time (= 100 %). SWA is expressed as the average over 24-h baseline (= 100 %). Asterisks and solid lines indicate where recovery significantly differed from baseline (p < 0.05, two-tailed paired t-test after significant ANOVA factor day). Right top and middle panel Cumulative NREM and REM sleep lost or gained. Plots are calculated by subtracting the minutes of sleep during deprivation (hatched bar at the top) and recovery from the corresponding baseline value and summing the difference with the preceding hour. Note that a significant part of the NREM sleep and REM sleep lost is not recovered. Asterisks and solid lines indicate where the sleep deprivation and recovery significantly differ from baseline (p < 0.05, two-tailed paired t-test after significant ANOVA). Right bottom panel Cumulative slow-wave energy (SWA*NREM sleep) for baseline (dots) and sleep deprivation/recovery (circles). Plots are calculated by summing the SWE with the previous hour. SWE is expressed as the total SWE over the 24-h baseline day (= 100 %). Note that SWE lost during the sleep deprivation is virtually totally recovered in the course of the recovery period. Asterisks and solid lines indicate where the recovery significantly differs from baseline (p < 0.05, two-tailed paired t-test after significant ANOVA factor day)
2.2 Homeostasis in the NREM Sleep EEG
From almost the earliest days of EEG sleep research it was clear that a positive correlation exists between depth of sleep , measured by the duration and intensity needed for a sound to wake the subject or animal, and the prominence of slow-waves (< 5 Hz) in the NREM sleep EEG (Blake and Gerard 1937; Ferrara et al. 1999; Neckelmann and Ursin 1993; Rosa and Bonnet 1985; Williams et al. 1964). By applying a fast Fourier transform (see Fig. 2) to the EEG, delta activity or slow-wave activity (SWA, EEG power density between ~1 and 4 Hz) can be calculated and quantified. In all mammals with a clear main sleep and wake period (either diurnal or nocturnal), slow-waves in the NREM sleep EEG are prominent at the beginning of the main sleep period and SWA gradually decreases as sleep progresses. Moreover, despite a few exceptions where the sleep deprivation may have been too stressful (Tobler and Jaggi 1987), in most mammalian and some bird species investigated, SWA in NREM sleep increases after sleep deprivation (reviewed in Deboer 2007; Rattenborg et al. 2009). Both are illustrated in Fig. 3 in the left bottom panel. Mammals seem to compensate for sleep loss by two different strategies. The amount of NREM sleep is increased, but also SWA in NREM sleep is increased. It proofed to be worthwhile to calculate a combined measure of cumulated SWA over time by multiplying NREM sleep SWA with NREM sleep time. The result is cumulative slow-wave energy (SWE, Fig. 3 right bottom panel). Although debated over with long or complex sleep deprivation protocols (Kim et al. 2007; Leemburg et al. 2010), the data after short sleep deprivations show that SWE lost during sleep deprivation can be totally recovered within a couple of hours. Finally, in humans it was shown that a nap of sufficient duration during the day decreases subsequent SWA in NREM sleep during the following night (Werth et al. 1996b).
In some mammalian species, a dose response relationship between waking duration and subsequent SWA in NREM sleep was established. An overview of these studies is shown in Fig. 4. Most species show an increase in SWA which depends on the prior sleep deprivation duration. However, there is a species specific difference in the speed of increase. Of the seven documented species, the Djungarian hamster is the animal with the fastest increase, whereas the tree shrew is the slowest and does not seem to show an increase with increasing time awake. The increase rates of the Wistar rat and European ground squirrel are similar to each other and also the increase rate of the cat and mouse are similar. Although not all data and species seem to be in a line with this idea, it has been suggested that there is a relation between the waking induced increase rate of SWA in NREM sleep and body or brain size of these species (Deboer et al. 1994). The odd ones out are the C57BL/6 mouse and the tree shrew. The latter indicates that other factors also play a role, but attempts to correlate sleep time over different species with various other parameters did not support any sleep physiological theory (Siegel 2005, 2009). Comparison between mouse strains suggests a genetic component for the build-up rate of sleep pressure (Franken et al. 2001; Huber et al. 2000a). More data, including more species, are needed to obtain a clearer picture.
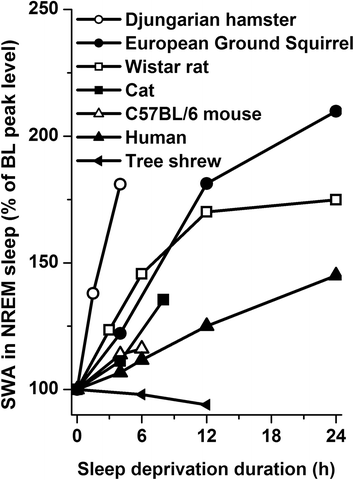
Fig. 4
Slow-wave activity (SWA; EEG power density between 1 and 4 Hz) in NREM sleep as a function of prior sleep deprivation duration in seven mammalian species. Animals were sleep deprived from the start of their main rest period when baseline SWA reaches its highest point. Data are plotted relative to this maximum baseline value. Note the difference in increase rate between the different species. Data of Djungarian hamster adapted from Deboer and Tobler (2003), C57BL/6 mouse from Huber et al. (2000a), Wistar rat from Tobler and Borbely (1986), European Ground Squirrel from Strijkstra and Daan (1998), Human from Akerstedt and Gillberg (1986), Cat from Lancel et al. (1991), and tree shrew from Coolen et al. (2012). Note the slower increase in SWA as brain and/or body size increases with the exception of the C57BL/6 mouse and the tree shrew
Most of these results indicate that there is some kind of process which keeps track of the prior duration of sleep and waking. The level of this process is reflected in SWA of the NREM sleep EEG, and the changes in SWA are predictable. This invites the application of mathematical modeling and simulations of the homeostatic sleep response. Until now, they have been applied successfully in human (Achermann et al. 1993), rat (Franken et al. 1991b) and mouse (Franken et al. 2001; Huber et al. 2000a). Yet, although major progress has been made in our knowledge of how the slow-waves in the NREM sleep EEG are produced by the brain (Amzica and Steriade 1998; Timofeev et al. 2012), still little is known about how and why they are homeostatically regulated. It is generally accepted that the slow-waves somehow reflect sleep need and therefore provide a window on the function of sleep. However, what this function is, and whether there is a central sleep homeostat in the brain, remains a topic of research and debate.
2.3 Changes in NREM Sleep Slow-Waves Independent of Waking Duration
Although, there is a clear relationship between waking duration and SWA in subsequent NREM sleep, several observations indicate that the occurrence of slow-waves in the NREM sleep EEG can change independent of waking duration. For instance, in infants, SWA in NREM sleep follows an alternating pattern, with high SWA in every second NREM sleep episode, independent of prior waking (Jenni et al. 2004). Also well documented is that the amplitude of slow-waves, and therefore SWA decreases in the course of puberty (Campbell et al. 2012; Kurth et al. 2010). In the elderly, the amplitude of slow-waves further decreases (Dijk et al. 1989, 1999; Landolt et al. 1996). These changes in the expression of slow-waves in the course of puberty and adult aging all occur without affecting sleep homeostatic responsiveness.
Also the quality of sleep and waking may be influencing SWA. Disturbed sleep reduces the ability to produce high amplitude slow-waves in the NREM sleep EEG (Deboer et al. 2003; Dijk and Beersma 1989; Endo et al. 1997, 1998). In albino rats, light during the main sleep/rest period suppresses SWA in NREM sleep (Tobler et al. 1994). However, in pigmented mice such an influence was not observed (Deboer et al. 2007b), suggesting that pigmentation or light sensitivity may be the determining factor in this influence of light on slow-waves. That the quality of waking may influence subsequent slow-waves was shown by, for example, Meerlo et al. (1997). Rats that were exposed to a brief period of intense social stress, i.e., had an encounter with an aggressive dominant conspecific, showed an increase in SWA during subsequent NREM sleep. This increase was larger than the level normally obtained after non-stressful sleep deprivation of similar duration. The authors speculated that the stressful social encounter may have represented a period of intense wakefulness causing a more rapid build-up of sleep debt.
Even the time of day where the spontaneous or induced waking occurs, seems to influence the subsequent SWA response in the NREM sleep EEG (Deboer 2009; Vyazovskiy et al. 2007; Werth et al. 1996b). This suggests an influence of the endogenous circadian clock on the expression of slow-waves, either indirectly by modulating the quality of waking in a circadian pattern, or directly by influencing the expression of slow-waves in the EEG.
Pharmacological manipulations can also influence the expression of slow-waves. Caffeine is well known to increase alertness during the day. In addition, it was shown in humans and animals that it also delays sleep onset and reduces SWA during subsequent NREM sleep (Deboer et al. 2013; Landolt et al. 1995a, b; Schwierin et al. 1996). Caffeine is thought to influence sleep propensity by blocking the adenosine receptors. In accordance with that, stimulating the adenosine A1 receptor increases sleep and SWA in NREM sleep (Benington et al. 1995; Deboer et al. 2013; Schwierin et al. 1996).
There are several other pharmacological manipulations that also influence sleep and SWA. Atropine induces high amplitude slow-waves without affecting sleep (Bringmann 1995; Schaul et al. 1978). Benzodiazepines increase NREM sleep, but reduce slow-waves (Bastien et al. 2003). Other substances enhance NREM sleep duration and SWA simultaneously, like tumor necrosis factor, growth hormone releasing hormone, and interleukin-1 (Obal and Krueger 2003). Others decrease SWA, but still increase the amount of NREM sleep, like nerve growth factor, neurotropin-4, and obestatin (Szentirmai and Krueger 2006). Not all pharmacological agents which influence the occurrence of sleep or SWA in the NREM sleep EEG are related to normal physiological changes in sleep or sleep pressure. For instance, gamma-hydroxybutyrate does not show a sleep promoting effect but at higher doses of GHB, EEG hyper synchronization with increased SWA together with a coma-like state is observed (Meerlo et al. 2004). Therefore, always the question should be asked whether the sleep-like state seen is true physiological sleep.
The genetic makeup can also influence the occurrence and strength of SWA in NREM sleep. In humans, an influence on SWA in NREM sleep was found in polymorphisms of genes influencing the level of adenosine in intracellular space (Bachmann et al. 2012; Retey et al. 2005), and polymorphisms in the per3 gene (Viola et al. 2007). In rodents, it was already shown in the 1970s that inbred mouse strains show differences in the occurrence and amplitude of slow-waves in the NREM sleep EEG (Valatx et al. 1972). Later it was shown that mouse strains show distinct differences in their EEG power density spectra (Franken et al. 1999; Huber et al. 2000a), and some of these differences were linked to differences in the genetics between the strains (Tafti and Franken 2002).
Finally, natural hypothermic states, like daily torpor and hibernation, can also change the occurrence of slow-waves during subsequent NREM sleep. Both after daily torpor and hibernation, animals show an increase in NREM sleep and SWA (Daan et al. 1991; Deboer and Tobler 1994; Trachsel et al. 1991). Combining daily torpor with sleep deprivations, it was shown in Djungarian hamsters that the increase in SWA after torpor was genuinely sleep-wake dependent. The animals postponed their deep NREM sleep with high SWA to a later time, when a sleep deprivation was applied (Deboer and Tobler 2000b). However, in ground squirrels, a sleep deprivation after hibernation made the subsequent increase in SWA disappear, indicating that it did not reflect the usual sleep-wake dependency (Larkin and Heller 1998; Strijkstra and Daan 1998). Research into this area has come more or less to a standstill and the discrepancy between hibernation and daily torpor has not been resolved until now (reviewed in Deboer 2005). Recently, it was shown that inducing a torpid like state in rats results in increased NREM sleep and SWA after rewarming (Cerri et al. 2013), similar to the findings obtained after daily torpor or in the course of hibernation.
The list of possible influences on SWA in NREM sleep, other than the duration of prior sleep and waking duration, shows that slow-waves may not only be an expression of a sleep homeostatic process, but may depend on global or local brain circuitry which can be manipulated by pharmacological agents and behavioral changes.
2.4 Local NREM Sleep Homeostasis
The observation that the dolphin exhibits deep slow-wave sleep only in on hemisphere simultaneously (Mukhametov et al. 1977), triggered the idea that sleep homeostasis may also have a local cortical component. Interestingly, experiments with selective deprivation of unihemispheric sleep in dolphins resulted in a unihemispheric slow-wave sleep rebound (Oleksenko et al. 1992). The data showed that sleep, and therefore the sleep homeostatic process, is not necessarily a global process, running in parallel in the entire brain. More recently, in land living mammals, it was shown that the time constants of the decrease rate of SWA and therefore the hypothetical homeostatic recovery process differs between cortical areas of the brain (Huber et al. 2000b; Palchykova et al. 2002; Rusterholz and Achermann 2011; Werth et al. 1996a, 1997). These findings supported the notion that a use-dependent local cortical mechanism may underlie the sleep deprivation induced changes in the slow-waves of the NREM sleep EEG (Benington and Heller 1995; Krueger et al. 1999).
This idea was tested in many different ways in many different mammalian species. Pioneering work by the group of Alex Borbely showed that local activation of a particular cortical area during waking results in EEG changes recorded from the same cortical area during subsequent sleep (Kattler et al. 1994). A vibratory stimulus was applied to the hand to activate the contralateral somatosensory cortex. The effect on the subsequent sleep EEG was most prominent in the slow-wave range of the EEG, and was restricted to the derivation, corresponding with the same cortical area. Subsequent research stimulating the barrel cortex via the vibrissae in mice (Vyazovskiy et al. 2004), the motor cortex with running wheel activity in mice (Vyazovskiy et al. 2006), or the use of paw preference in rats (Vyazovskiy and Tobler 2008), showed that this is probably a universal property in mammals. An elegant experiment in humans applying a motor learning task (Huber et al. 2004a), which involves a restricted part of the cortex, confirmed the notion that local cortical SWA during NREM sleep can be changed under influence of the workload during previous waking in that particular part of the cortex. Recent data in the rat show that animals that are awake, which is confirmed by the global EEG, on a local cortical level can express slow-waves of which the timing correlates with hits and misses on a reaching task (Vyazovskiy et al. 2011). Together the data indicate that the occurrence of slow-waves and their homeostatic changes can be a local cortical phenomenon.
The discovery of this local cortical homeostasis in slow-waves may have consequences for our thinking about sleep homeostasis and its relation with sleep regulatory mechanisms. Local sleep homeostasis shows that the occurrence of slow-waves, which was previously thought to be a marker for a global sleep homeostat, is influenced by use-dependent local processes. The fact that sleep regulatory models, based on SWA, have some predictive value, concerning the timing of sleep, suggests that these local changes in sleep homeostasis may be translated into a general signal influencing the switch between sleep and wakefulness. This may require that one or more brain regions involved in sleep regulation monitors local sleep homeostasis over the entire cortex. Candidate areas are those involved in sleep regulation on the neuronal level. These include histaminergic tuberomammilary nucleus (TMN) of the hypothalamus, noradrenergic cells in the locus coeruleus (LC), serotonergic cells from the dorsal raphe (DR) nucleus, and cholinergic cells in the pons (Saper et al. 2001). Next to inhibiting sleep promoting neurons in the ventrolateral preoptic area, the aminergic neurons from TMN, LC, and DR are thought to promote waking via excitation of arousal systems in the hypothalamus , thalamus , basal forebrain (BF), and cortex . Inhibition of cholinergic neurons in the BF by release of adenosine promotes NREM sleep (Jones 2004). Alternation between NREM and REM sleep is thought to be caused by cholinergic, serotonergic, and norepinephrinergic systems in the pons, LC and DR (McCarley and Massaquoi 1992). In addition, the endogenous clock, residing in the suprachiasmatic nucleus of the hypothalamus (Meijer and Rietveld 1989) is thought to provide the sleep–wake neuronal mechanisms with a circadian framework, promoting sleep and waking at the proper time of the day.
That changes in cortical activity may influence these deeper brain areas are not as unlikely as it may seem. In the past, we have observed a correlation between the activity of neurons in the suprachiasmatic nucleus and SWA in NREM sleep (Deboer et al. 2003, 2007a). This finding shows that changes related to sleep homeostasis can also be found in the activity of neurons in deeper brain areas. For the sleep homeostatic model to work, it may require a general field detector of local cortical sleep homeostasis to be located in a brain area involved in sleep initiation and maintenance.
Whether we look at sleep as a behavior or as a physiological brain state, the homeostatic component is visible in both behavior and physiology and can be seen as a general and defining property of sleep in all animals. In mammalian and bird sleep, the analysis of changes in the sleep, EEG in relation to sleep–wake duration has become very important. The discovery of local cortical sleep-like phenomena sheds new light on sleep physiology and implementing these into models of sleep regulation is needed for a comprehensive picture of the mechanisms of sleep regulation.
2.5 REM Sleep Homeostasis , or Not?
NREM and REM sleep alternate in a cyclic pattern and the occurrence of REM sleep can be described in cyclic interaction models (McCarley and Massaquoi 1992), which results in a fairly constant ratio between NREM and REM sleep under undisturbed baseline conditions. Next to that, in humans, REM sleep is strongly influenced by the circadian clock (Carskadon and Dement 1975; Dijk and Czeisler 1995; Lavie and Scherson 1981), but in rodents this may be less the case (Yasenkov and Deboer 2010, 2012).
REM sleep often displays a rebound increase after sleep deprivation (Fig. 3; Borbely and Neuhaus 1979; Borbely et al. 1984; Dement 1960) and it is still generally believed that REM sleep recovery largely occurs through an increase in REM sleep time. However, similar to NREM sleep this recovery is generally not complete (Fig. 3). A number of studies have reported subtle changes in the REM sleep EEG following sleep deprivation, particularly in the theta frequency range, suggesting that REM sleep quality or intensity may change as well (Borbely et al. 1984; Endo et al. 1998; Tobler and Borbely 1986). However, in contrast to the well-established homeostatic regulation of NREM sleep in relation to prior wakefulness, rebounds in REM sleep time are less predictable and may only occur after longer sleep deprivation duration. In addition, it is still debated whether REM sleep is homeostatically regulated in relation to prior waking or to prior NREM sleep (Benington and Heller 1994; Franken 2002b; Ocampo-Garces et al. 2000). The analysis of REM sleep regulation is complicated by the fact that the expression of REM sleep is also highly sensitive to modulation by various other factors. For example, brain temperature (Deboer and Tobler 1996; Parmeggiani et al. 1975), environmental temperature (Amici et al. 1998, 2008; Roussel et al. 1984), and stress (Meerlo et al. 2001; Rampin et al. 1991; Sanford et al. 2010) are shown to influence the occurrence of REM sleep. Moreover, the influence of stress is not unambiguous. Uncontrollable foot-shock stress significantly suppresses REM sleep, but with no subsequent rebound (Sanford et al. 2010). In contrast, exposure to immobilization stress, with only minor loss of REM sleep, increases subsequent REM sleep beyond baseline levels (Meerlo et al. 2001; Rampin et al. 1991).
3 Functional Implications
Life as we know it evolved on a rotating planet. As a result, almost all species developed a timing system that shows persistent circadian oscillations, even under constant conditions. Organisms that are able to predict daily changes in temperature, radiation and food availability have an advantage over organisms that cannot predict these changes (Ouyang et al. 1998; Woelfle et al. 2004). Depending on the environmental time, the organism is active or resting. In addition, the clock needs to coordinate and streamline internal physiology to optimize energy expenditure and the use of internal recourses. During the active phase ingestion and reproduction are prominent, during rest maintenance and growth. As soon as animals developed a central nervous system, this also became part of the already existing rest-activity cycle. One can hypothesize that for maintenance this organ needs to go off-line like the rest of the body, and this condition is what we now call sleep.
In contrast to activities like, foraging, eating, drinking, and mating, the benefits of sleep are unclear. However, the costs of sleep seem to be substantial. Sleep leaves the animal defenseless for more or less a third of its life, and if it were not essential, natural selection would long since have eliminated sleep. But until now, no vertebrate has been found which does not spend a significant amount of its life asleep (Campbell and Tobler 1984). That alone is already a strong indication that sleep is important. Disruption of sleep can have large consequences for health and well-being (Aldabal and Bahammam 2011; Baglioni et al. 2011; Durmer and Dinges 2005; Meerlo et al. 2008; Spiegel et al. 2009) and prolonged sleep deprivation may lead to death (Everson et al. 1989; Kleitman 1927; Manaceine 1894). Sleep therefore seems to fulfill an important function, which cannot be fulfilled during wakefulness. In the history of its extensive scientific study, numerous theories for the function of sleep have been proposed and rejected and no satisfactory explanation for the necessity of sleep has been offered. The fact that in mammals and birds two distinct sleep states are found supports the notion that sleep may have at least two functions, and from an evolutionary perspective there may even be many functions of sleep.
Related posts:
 Memory Consolidation in Healthy Aging and Mild Cognitive Impairment
Restricted or Disrupted Sleep as a Causal Factor in the Development of Depression
Memory Consolidation in Healthy Aging and Mild Cognitive Impairment
Restricted or Disrupted Sleep as a Causal Factor in the Development of Depression
 Treatment of Sleep Disorders and Its Relationship with Neuroplasticity
 Bird’s Eye View of Sleep-Dependent Memory Consolidation
 and Synaptic Homeostasis
 Studies of Sleep and Memory in Humans
Stay updated, free articles. Join our Telegram channel

Full access? Get Clinical Tree


