Basic EEG Technology
Thoru Yamada
Elizabeth Meng
Personnel in the EEG Laboratory
All EEG laboratories have, at minimum, two members of the staff: an EEG technologist and an electroencephalographer. An EEG technologist or NDT (neurodiagnostic technologist) is an allied health care employee who specializes in the recording of EEG and other neurodiagnostic procedures. An electroencephalographer (or so-called EEGer) is a physician (usually a neurologist) who has expertise in clinical neurophysiology. The role of the technologist is to explain the testing procedure to the patient, prepare the patient, and perform the EEG recording. The technologist is skilled in obtaining technically satisfactory recordings by modifying recording parameters and noting patient behaviors and other factors that may affect the recording, allowing for appropriate and accurate EEG interpretation by the EEGer. The EEGer should also have a technical background and be able to recognize various artifacts, technical modification, or technical errors in order to avoid misdiagnosis (see Chapter 15).
Most laboratories will find it invaluable to employ a secretary to register patients, schedule procedures, and type and file reports. It is also very helpful to have a biomedical technician or an electrical engineer to take care of equipment maintenance, troubleshoot problems, and do periodic electrical safety checks on the instruments.
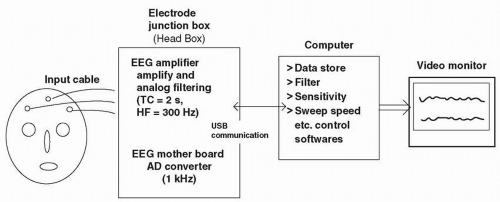 FIGURE 2-1 | Schematic model of digital EEG system. In the electrode junction box, EEG signal is amplified and filtered (analog filter) commonly with high frequency of 300 Hz and TC of 2 s. Restricting the bandpass of the amplified signal eliminates external interference. The filtered signal is then sent to the A/D converter, with a sampling rate of 1,000 Hz. The digitized data are then sent to the computer for data storage (data from each channel are stored with a single reference format) and also for reformatting to appropriate parameters (montage, sensitivity, filter bandpass, etc.) to be displayed on the video monitor screen. |
Electrodes
CONVENTIONAL ELECTRODES
An EEG is recorded from electrodes attached to the scalp. These electrodes are made of metal, most commonly platinum, gold, or silver-silver chloride. They are 4- to 10-mm discs attached to a wire that is plugged into an electrode board and, eventually, the EEG instrument (Fig. 2-1). The choice of electrode metals is based on cost, convenience, and quality. Platinum electrodes are very expensive and used for special recording purposes. Gold electrodes are actually silver with a gold overlay. The silver-silver chloride electrode is the most commonly used electrode consisting of silver that is treated with a salt solution that changes the surface of the electrode. This electrode requires some maintenance to keep the electrode chlorided. All three of these metals have good recording qualities with minimal drift of electrical potentials and a long time constant (TC; see “Filter Settings” in this chapter), allowing better reproduction of many recording frequencies. Whichever metal is chosen, it is preferable to use the same metal for all electrodes since a pair of electrodes of different metals has different TCs, resulting in an alteration of the waveform.
An electrode placed on the scalp will have an electrolyte (conductive jelly) placed between the scalp and the electrode.
This interface has properties of capacitors and resistors (Fig. 2-2) and forms an impedance that is “resistance” against alternating current (AC) flow. After the electrodes are placed on the scalp, it is important to lower the electrode impedance. It is preferred that electrode impedance be less than 5 kΩ, but at minimum, less than 10 kΩ.1,2 Because of the properties of the amplifiers used in EEG, unequal impedance between two electrodes in a pair creates an imbalance that can hinder the recording quality (see next paragraph). Impedance of less than 5 kΩ on all electrodes is best, but if that is not possible, impedances of 9 to 10 kΩ on all electrodes would be preferable to having impedance difference at 1 kΩ for one and at 10 kΩ for the other. It is best to have no more than 5 kΩ difference between the highest and the lowest impedance readings. Most EEG equipment has some method of checking impedance built into the instrument. High-electrode impedance tends to produce artifacts by slight movements of the head, body, or even the electrode wires.
This interface has properties of capacitors and resistors (Fig. 2-2) and forms an impedance that is “resistance” against alternating current (AC) flow. After the electrodes are placed on the scalp, it is important to lower the electrode impedance. It is preferred that electrode impedance be less than 5 kΩ, but at minimum, less than 10 kΩ.1,2 Because of the properties of the amplifiers used in EEG, unequal impedance between two electrodes in a pair creates an imbalance that can hinder the recording quality (see next paragraph). Impedance of less than 5 kΩ on all electrodes is best, but if that is not possible, impedances of 9 to 10 kΩ on all electrodes would be preferable to having impedance difference at 1 kΩ for one and at 10 kΩ for the other. It is best to have no more than 5 kΩ difference between the highest and the lowest impedance readings. Most EEG equipment has some method of checking impedance built into the instrument. High-electrode impedance tends to produce artifacts by slight movements of the head, body, or even the electrode wires.
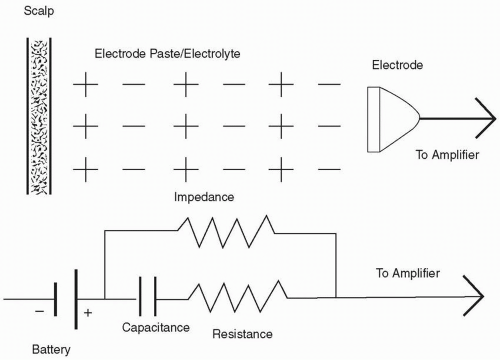 FIGURE 2-2 | Schematic model of electrode attached to the scalp with conductive jelly. (Modified from Tyner FS, Knott JR, Mayer WB Jr. Fundamentals of EEG Technology. New York: Raven Press, 1983, with permission.) |
A common artifact, “electrode pop,” may mimic abnormal EEG activity (see Fig. 15-26A and B). This electrically unstable electrode pop can be caused by an electrolyte that has become dry or by an unstable electrode surface contact with the skin. The electrode pop is not related to electrode impedance; therefore, it may occur even when impedances are low. The pop may occur when silver-silver chloride electrodes are not well chlorided. If using silver-silver chloride electrodes, chloriding should be done periodically.3 This can be done by placing silver electrodes into 1% to 5% sodium chloride (NaCl) solution in a nonmetallic container and sending a weak current (<1 mA) to the electrodes to be chlorided. Bright, unchlorided silver electrodes will darken slowly to a uniform gray color as chloriding progresses.
SPECIAL ELECTRODES
Subdermal Needle Electrodes
These electrodes are inserted just beneath the skin. Because of infection control issues, these electrodes should be of a disposable type. There are many problems associated with the use of needle electrodes4; therefore, the American Clinical Neurophysiology Society5 (ACNS) (formerly the American EEG Society) does not recommend their use for routine EEG recording. However, subdermal needle electrodes have been commonly used for intraoperative monitoring because they are quickly and easily placed without discomfort to the patient under anesthesia. Special care must be taken when placing needle electrodes in order to (i) maintain sterility of the puncture site and (ii) dispose of the used needles in a proper “sharps” container.
Nasopharyngeal Electrodes
Nasopharyngeal (NP) electrodes are usually referred to as PG1 and PG2 and are used to noninvasively record activity from the inferior and mesial temporal lobe as well as orbitofrontal activity (Fig. 2-3B). They are inserted via the nostril and are carefully rotated so that the tip will be in contact with the roof of nasopharynx. They are usually made of insulated semiflexible Z-shaped wire of about 12.5 cm in length with a silver ball exposed at the tip.
The use of NP electrodes results in a higher yield of epileptiform activity when compared to recording with only scalp electrodes.6,7 Because of unstable contact with the pharyngeal mucosa, NP recordings are often contaminated by respiration, eye movement, or other artifacts, especially when used on patients who are awake. Generally, an NP electrode study without a sleep recording is unyielding. If NP electrodes are to be used, it is recommended that the patient is sedated or sleep deprived prior to the study to increase the probability of gaining a sleep recording. NP electrodes are not suitable for long-term EEG monitoring. Other special electrodes have been developed for this specialized use.
Some studies have indicated that surface electrodes over the cheeks, T1 and T2 (see “Electrode Nomenclature”), or the use of long interelectrode distances are equally as effective for detecting mesial temporal lobe abnormalities.8,9
 FIGURE 2-3 | A: Top view of the International 10-20 system for electrode placement. B: Lateral view of the International 10-20 system in relation to the surface of the brain. (From Jasper HH. Report of the committee on methods of clinical examination in electroencephalography. Electroencephalogr Clin Neurophysiol 1958;10:370-375, with permission.) |
OTHER SPECIAL ELECTRODES
Electrodes have been developed to monitor specific body functions. There are electrodes to record air flow from the nose or mouth, movement of the chest with respirations, tremors of the extremities, etc. Use of these special electrodes can make the interpretation of EEG more accurate and should be used when necessary.
For long-term EEG monitoring, especially for the evaluation of a seizure focus in patients with intractable epilepsy who are candidates for surgical treatment, special electrodes have been developed. These include sphenoidal electrodes,10 foramen ovale electrodes,11 tympanic electrodes,12 ethmoidal electrodes,13 depth electrodes,14 and subdural electrodes.15 These will be discussed in more detail in Volume II.
Electrode Placement
Standard electrode placement uses 21 electrodes in accordance with the 10-20 International System of Electrode Placement recommended by the International Federation of Societies for EEG and Clinical Neurophysiology in 195816 (Fig. 2-3A). This system was developed to gain consistency between laboratories. It also ensures consistency for each patient as follow-up EEG recordings are done. The system is based on percentages (10% or 20%) of the total size of the head. Anatomical landmarks are identified that can be found on most people. These landmarks are the nasion and the inion (for the anterior-posterior plane) and the left and right preauricular points (for the transverse plane) (Fig. 2-3A and B). The nasion is located at the bridge of the nose. The inion is the bump midline on the back of the skull above the hairline. It can be felt more easily if the patient is directed to move his head forward and back while the tech feels the back of the head. The preauricular points are on each side of the head. The actual point is at the notch that can be felt just anterior to the tragus of the ear. It can be more readily palpated if the patient is directed to slightly open and close the jaw. For practical purposes, the notch just above the tragus may be used as a preauricular point. Accurate measurement with equal interelectrode distances for homologous electrode pairs is essential; unequal distances will cause a spurious amplitude asymmetry (the shorter the interelectrode distance, the lower the amplitude) (see Fig. 15-48A and B). The only changes in this system should occur when the skull does not allow adherence. It might be necessary to misplace the electrodes, if, for example, there is a bandage on a portion of the skull that cannot be removed. Symmetry between homologous electrode pairs should still be
attempted by also misplacing electrodes on the other side. When these changes are necessary, a diagram of the alteration must be documented by technologist. In addition to these electrodes, a ground electrode must be placed, which can be anywhere on the scalp, but often, Fpz (between Fp1 and Fp2) is used.
attempted by also misplacing electrodes on the other side. When these changes are necessary, a diagram of the alteration must be documented by technologist. In addition to these electrodes, a ground electrode must be placed, which can be anywhere on the scalp, but often, Fpz (between Fp1 and Fp2) is used.
ELECTRODE NOMENCLATURE
The electrode positions are named according to the relationship with the underlying brain anatomy or lobe (Fig. 2-3B). “F” is designated for electrodes over the frontal lobe, “P” for parietal, “O” for occipital, and “T” for temporal lobe. “C” refers to central electrodes, which closely overlie the central sulcus or Rolandic fissure of the brain (see Fig. 2-3B). “FP” refers to the frontopolar electrodes, which are placed just above the eyes and located over the frontal poles of the frontal lobes.
Each electrode, besides a letter name, also has a number in it’s name. Even numbers represent the right side of the head; odd numbers refer to left side. The middle (or midline) is called “Z”. The numbering system starts at the midline (Z) and progresses laterally; thus, F3 is closer to the midline than F7 but both are on the left side. If a technologist chose to add an electrode between F3 and F7, it would be called F5 (according to a new modified nomenclature) (Fig. 2-4).
Generally, 19 electrodes are placed on the scalp and one electrode is placed on each ear lobe (occasionally, it is necessary to use the mastoid instead of the ear lobe). The ear electrodes are called A1 and A2 standing for Auricular 1 and Auricular 2. They are commonly used as the reference electrodes (see “Montages” in this chapter).
Instead of using F7 and F8, some prefer to use T1 and T2, which are located 1 cm above and one third the distance from the external auditory meatus to the outer cantus of the eye. T1 and T2 are closer to the anterior temporal lobe than F7 and F8,17 but this placement does not follow the rules of the 10-20 system and, therefore, should be labeled as a variance from the International 10-20 system.
 FIGURE 2-4 | Modified combinatorial nomenclature to be used for detailed topographic mapping of EEG activity. (From American Clinical Neurophysiology Society. Guideline 5: Guidelines for standard electrode position nomenclature. J Clin Neurophysiol 2006;23(2):107-110, with permission.) |
In recent years, the application of computer technology has made it possible to analyze spatial potential fields in more detail for EEG and evoked potential studies. The ACNS published a modification of the International 10-20 system with additional electrodes located by further dividing the distances between standard placements (Modified Combinatorial Nomenclature).18 With this new system, T3 and T4 became T7 and T8, respectively. T5 and T6 became P7 and P8, respectively (Fig. 2-4). This nomenclature has not been widely used for routine clinical EEG but has been proven useful in research fields.
MEASURING FOR ELECTRODE PLACEMENT
An essential role of the EEG technologist is to accurately and securely place electrodes. It can take several months of practice to perfect the technique, but once learned, the procedure can be accomplished in less than 30 minutes.
A grease pencil (china marker) is usually used to place measurement marks on the head. A millimeter tape measurer is important. The retractable measurers are good but must be wiped clean between uses. There are also disposable, paper tapes available. Each technologist develops his or her own preferences and techniques that work for measuring the head. But to have a starting point, step-by-step directions are included from which to practice. You will note that a spot is not ready for electrode placement until it has two marks making a +. Refer to Figure 2-3A when practicing measuring the head. You will also find a video about measuring and marking electrodes on your on-line reference. (The code is under a scratch off inside the front cover of this text.)
Measure the distance from the nasion to the inion down the middle of the head (the sagittal plane). Calculate 50% of that number and place a mark perpendicular to the tape at that spot (Cz). Then, starting at the nasion, put another mark at 10% of the total measurement (Fpz). At this time, place a crossing mark at Fpz that is in line with the nose, therefore being on the midline. You can then move the tape to measure between Fpz and Cz. Place a mark halfway between them. (This also turns out to be 20% of the total.) Move the tape again to Cz and measure the same 20% distance back to Pz and again to Oz. (Usually, there is no electrode placed at Fpz and Oz. They are used for measurement of other electrodes only.) There should now be 10% of the total remaining to reach the inion.
Measure the total distance from the left preauricular point to the right, going through the partial mark at Cz (the coronal plane). Calculate 50% of that number and place a mark perpendicular to the tape at that spot. The mark should intersect with the original Cz mark to make a +. Then, starting at the left preauricular point, put another perpendicular mark at 10% of the total measurement (T3). You can then move the tape to measure between T3 and Cz. Place a mark halfway between them (C3). (This also turns out to be 20% of the total.) Move the tape again to Cz and measure the same 20% distance down toward the right preauricular (C4) and again to T4. There should now be 10% of the total remaining to reach the right preauricular point.
The next measurement is the total circumference of the head. Start at Fpz, part off the hair as much as possible, and continue running the tape all the way around the head, making sure to pass through T3, Oz, and T4. This measurement is then divided into 10 segments, each 10% of the total. The first 10% is between Fp1 and Fp2
(5% on each side of Fpz). Then, move the tape to Fp1 and measure back toward T3. Put a mark at the 10% number (F7) and another mark at twice that number, which should cross with the previous T3 mark. Move the tape to T3 and measure toward Oz, marking at 10% for T5 and another 10% for O1. O1 can be cross marked by visually lining it up with the original mark placed at Oz. Then, start at Fp2 and move to the right using the same procedure to measure for F8, T4, T6, and O2. O2 can also be cross marked if it is in line with Oz. You will note that F7, F8, T5, and T6 do not have cross marks yet. These can be added at this time. Use the tape measurer as a straight edge. Lay it between Fp1 and T3. Make sure that it is placed above the mark on both ends. Then, find the original mark at F7 and cross that mark by running a mark along the bottom of the tape measure. The same procedure can be used to cross mark the remaining three electrode locations. It is important that if your tape is lined up above two electrodes, the mark you make should be below the tape. You could instead line the tape up below two electrodes, but then the mark would be made above the tape to end up on the same plane.
Now, measure from F7, through Fz, to F8. Half that distance should mark the midline at Fz. Measure from F7 to Fz. Place a mark at the halfway spot for the first F3 mark. Move the tape and measure from Fz to F8. Again, half that distance will be the first mark for F4. Do the same in the back of the head by measuring from T5, through Pz, to T6. At half that distance, a mark should intersect the original Pz mark that identifies the midline. Next, measure from T5 to Pz where the first P3 mark will be in the middle. Then, measure from Pz to T6 to place the first P4 mark in the middle. These measurements are somewhat difficult as the tape must follow the curve of the head.
The last remaining measurements will cross mark F3, F4, C3, C4, P3, and P4.
Start by measuring from Fp1, through the original mark at C3, to O1 (the parasagittal plane). Cross mark C3 at half this distance. Then, move the tape back to Fp1 and measure to C3. Cross F3 at half this distance. Move the tape again to C3 and measure to O1. Cross P3 at half this distance. Do the same on the right to cross F4, C4, and P4. These measurements must also follow the curve of the head.
Electrode Application
SKIN PREPARATION
To ensure low impedance between the electrode and the scalp, the skin should be thoroughly cleaned. Many products are available that serve this purpose. Put a little cleansing gel onto a paper towel and dip a cotton-tipped applicator into it. Gently scrub the area just in the middle of the cross that was made while marking the head. Be aware that these gels are abrasive. Excessive scrubbing can irritate the skin. It will take a little practice to decide how aggressive to be without undue discomfort to the patient. Also, be careful not to clean off the entire mark. The mark is there to guide electrode placement. If it is completely rubbed off, placement will not be accurate. When placing electrodes to be used in a long-term EEG, the gel should be wiped from the scalp before placing the electrode to help in avoiding skin breakdown.
APPLICATION METHODS
The most common adhesives used in routine EEG recording are paste and collodion (ether-based glue). Paste is relatively quick, has no unappealing odors, and cleans off fairly easily. But paste is not a stable application method. Head movement or sweating can cause electrodes to shift or fall off. Therefore, paste is not suitable for difficult patients, children, long-term recordings, or surgical monitoring. Collodion-applied electrodes are very stable and can stay on the head for days to weeks with only minimal maintenance. But collodion is flammable; has a strong, sometimes unpleasant, odor; and must be removed with acetone (another strong-smelling chemical). It also takes longer to apply a set of electrodes with collodion than with paste.
In some institutions, the technologist will be able to choose which method to use. But some practice settings might not allow the use of collodion because of its flammability and odor while others might not allow paste, preferring a more stable application.
Paste Application
Put a small amount of paste on a paper towel. Each technologist tends to develop a system to determine the order of application. If the patient is sitting, starting with the front of the head works well. If the patient is lying down, starting with the back of the head on one side might be preferable. Scoop a small amount of paste from the paper towel into the cup of the electrode. To avoid possible cross contamination, do not dip the electrode into the paste jar. There should be enough paste so that when applied, a very small amount leaks out around the electrode. Excessive amounts of paste must be avoided as the recording area encompasses the entire paste/electrode junction. Once applied, a piece of gauze, cotton, or even paper towel applied over the electrode will secure the stability of the electrodes. It is helpful to run the electrode wire away from the face and in a direction that does not fight gravity.
When the EEG is completed, paste electrodes can be gently pulled off the head and the residue cleaned away with a warm, wet washrag. Electrodes should be cleaned with soap and water using a soft brush and then disinfected with an appropriate solution.
Collodion Application
For collodion application, a supply of pressurized air is necessary to dry the glue. This can be accomplished by tapping into the medical air line (if available) in the wall, by a portable air pump, or by “canned” air sold most typically for dusting electronic parts. Place the electrode on the scalp. While holding it in place, cover it with a 1-inch square piece of gauze that has been dipped into collodion. Then, dry the collodion with air. Care must be taken so that the electrode does not move from the desired location while drying the glue. Protecting the patient’s eyes and clothing is also a concern when using collodion and precautions should be observed. Collodion tends to splatter a little when the air is turned on. Once the electrodes are in place, an electrolyte must be added to fill the space between the scalp and the electrode. These products are readily available. The electrolyte can be injected under the electrode (through a small hole in the cup) using a syringe with a blunted needle (or stub adaptor). The electrolyte should just fill the cup, not overfill it. When finished, the blunted needle or stub adaptor should be disposed of in a hospital grade sharps container.
Some technologists use a combination of paste and collodion. A scoop of paste helps to hold the electrode in place while a gauze square soaked in collodion is applied. In this method, additional electrolyte is unnecessary (the paste has electrolyte qualities).
If collodion has been used, acetone (or acetone-free collodion remover) is the only suitable method of removal. It can be applied liberally using a cotton ball, gently rubbing until the electrode falls off. Care must be taken to ensure that acetone does not get into the eyes or on the clothing. Once the electrodes are removed, additional scrubbing with acetone will be necessary to remove residue in the hair and on the scalp. Electrodes should be cleaned with a soft brush and warm, soapy water. It is also helpful to soak them for a few minutes in acetone to remove collodion residue from the electrodes. Once rinsed clean, an appropriate disinfectant should be used.
The Differential Amplifier
A pair of inputs (electrodes) is required to appropriately amplify the EEG signal. These two inputs used to be called “G1” and “G2,” corresponding to a “grid” of the “old-fashioned” vacuum tube amplifiers. But in a solid-state amplifier, the differential amplifier is, in effect, made up of two separate amplifiers such that each (input 1 and input 2) records with respect to a third one (usually the ground electrode) (Fig. 2-5). The output of a differential amplifier reflects the voltage difference between the two inputs (input 1 and input 2); if the difference is a negative value, or the activity of input 1 is relatively more negative as compared to input 2, the deflection of the EEG activity goes up. Conversely, if the difference between input 1 and input 2 is a positive value, the deflection goes down. If there is no difference in voltage between input 1 and input 2, there will be no deflection (equipotential). This is an important concept in localizing EEG abnormalities and should be clearly understood for appropriate and accurate interpretation.
If the differential amplifier is perfectly matched and balanced, signals of the same phase, polarity, and amplitude entering both inputs should result in total cancellation, that is, zero voltage. For example, external interference such as 60 Hz common to both inputs should be cancelled out if the amplifier is balanced. In reality, the amplifier is never perfectly balanced and the degree of “imperfection” is expressed by the common mode rejection ratio (CMRR), which is the ratio of the amplification gain for the differential signal to that for the common mode noise. The CMRR is commonly at least 10,000:1. Even if the amplifier is balanced with a high CMRR, the balance can be externally disturbed simply by using unbalanced electrode impedances between the two inputs (e.g., one electrode has much higher impedance than the other), which commonly results in the introduction of 60-Hz artifact (see Fig. 15-25A).
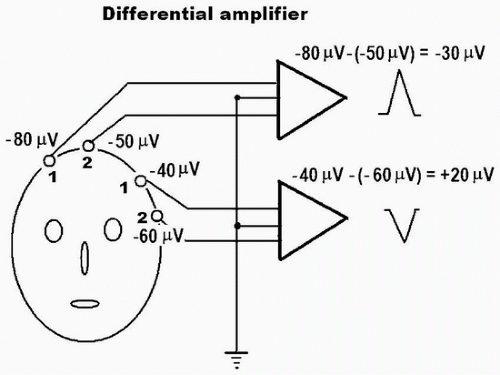 FIGURE 2-5 | Schematic model of a differential amplifier. The output is the result of the difference between input 1 and input 2. If subtracting input 2 from input 1 results in a negative value, the signal deflection is upward. If the difference is a positive value, the signal deflection is downward. |
The Amplifier Controls
EEG amplifiers have several controls that aid in the proper display of EEG activity. It has traditionally been the role of the EEG technologist to be expert in the use of these controls to best display the abnormalities in the recording. With the advent of digital EEG, however, it is imperative that EEGers also understand these controls as they will frequently review the EEG, making their own control choices rather than using those provided by the technologist.
AMPLITUDE (VERTICAL) SCALE
The amplitude scale is usually expressed by a voltage value per millimeter of deflection. This is based on the traditional analog EEG, which utilized pens writing on paper and a “sensitivity” control that dictated how much voltage was represented by each millimeter of pen movement. A simple calculation can be an aid in sensitivity problems:
S = V/H
where S = sensitivity (µV/mm), V = voltage (µV), and H = height of pen deflection (mm).
This formula can be used to find any value if the other two are known. If the voltage is unknown, use V = S × H. If the amplitude is unknown, use H = V/S.
The most commonly used sensitivity setting is 7 µV/mm. This means that each millimeter represents 7 µV of activity. In a digital system, however, a sensitivity setting may be less accurate because the amplitude scale (or height) may be different or can be adjusted depending on the size of the screen or computer program. Also, the scale may be different when the EEG is printed out on paper, depending on the paper size or the printing program. Nonetheless, adjusting vertical scaling close to a sensitivity of 7 µV/mm would be appropriate for conventional EEG interpretation. Though 7 µV/mm is a good starting point for visual inspection and interpretation of most routine EEGs, the setting should be adjusted according to the activity being recorded. If the activity is very high amplitude, a decrease in sensitivity is in order. Note that a decreased sensitivity will actually have a larger number on the setting. Therefore, S = 10 µV/mm is less sensitive than S = 7 µV/mm. Remember, when making this particular adjustment, 1 mm of deflection will now represent 10 µV rather than 7 µV. If, instead, the recorded activity at S = 7 µV/mm is very low amplitude and difficult to see, a more sensitive setting of S = 5 µV/mm will increase the size of EEG activity. Now, each millimeter of deflection represents 5 µV.
 FIGURE 2-6 | Amplitude (µV) and duration (ms) based on the calibration scale. |
When calibrating the EEG system, a 50 µV signal should measure 5 mm of height on the screen at S = 10 µV/mm. When the EEG is printed on a paper (usually 8 ½ × 11 inch), the scale may be slightly different. For accurate amplitude (µV) measurement of a wave, the following formula is used (Fig. 2-6):

TIME (HORIZONTAL) SCALE
The time scale in EEG is expressed in one of two ways: (i) the number of millimeters the sweep moves in 1 second (i.e., 30 mm/s) or (ii) the number of seconds visualized on a full video screen (i.e., 10 to 15 s/page). The first option is based on the traditional, paper written (analog) EEG. The instrument was designed to have the paper move at a rate of 30 mm every second. The paper speed control would allow an adjustment to double or half the speed. In some cases, the control would allow for speeds as slow as 6 mm/s. Since digital EEG has no moving paper, it is now more common to describe paper speed in terms of seconds per page. The most common setting is a 10 to 15 s/page. Similar to vertical scale (amplitude scale), horizontal scale (time scale) can be different depending on the monitor size and program. Again, it is reasonable to use a similar scale as was established in analog EEG, that is, a monitor screen should be set as close as possible to 30 mm/s and 10 to 15 s for full screen. Whichever setting is used, it is important to use a standard time scale for ease of visual inspection and interpretation. EEG frequencies appear to be slower when viewed with a faster time scale (i.e., 5 s/page) (see Fig. 15-36A and B) or faster when viewed with a slower time scale (i.e., 30 s/page) (see Fig. 15-37A and B). There are good uses of both the faster and the slower speeds. Faster speeds allow better visual inspection and more accurate measurement of the timing or frequency of a given activity of interest. Slower speeds can sometimes help visualize a subtle slow-wave abnormality or periodicity in case of slow periodic activity (Fig. 10-31). Slower speeds are also commonly used in sleep studies (polysomnography): 10 mm/s or 30 s full screen. When a digital EEG is printed on paper, the time scale will change depending on the print program that is used and on the size of the paper. The following formula can be used to calculate the duration (frequency) of a given wave on the paper measured with a ruler (Fig. 2-6):

The duration of a wave can be converted to frequency (Hz) by using the following formula:
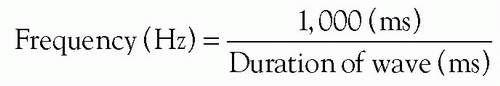
Figure 2-7 shows an example of measurement for amplitude, duration, and frequency values of an actual EEG sharp discharge.
FILTER SETTINGS
EEG activity consists of a composite of various frequencies. The bandwidth for routine EEG is conventionally from 1 to 70 Hz. Activity outside of this range is attenuated or totally eliminated. This attenuation or elimination is the result of the function of filters. Filters are used to minimize or eliminate activity that is not of value and to enhance activity of interest. The two filters that are of most use in EEG are (i) the low-frequency filter (LFF) and (ii) the high-frequency filter (HFF). The LFF can enhance or eliminate slower (lower) frequency activity without affecting faster (higher) frequency activity. Therefore, it is also called a high-pass filter. The HFF, conversely, can enhance or eliminate faster (higher) frequency activity without affecting slower (lower-) frequency activity. Therefore, it is also called a low-pass filter. Knowledge of the filtering effects is essential because their use can completely alter the ability to see particular frequencies that might be of value. A frequency response curve for the filters being used can aid in understanding the effect of the filter on various frequencies. Figure 2-8 shows a frequency response curve for four common LFF settings and three HFF settings. Note that the frequency scale on the x-axis is a logarithmic scale. The y-axis shows a percent of the total amplitude that is displayed using each filter.
 FIGURE 2-7 | The amplitude (µV) and duration (ms) of a given wave from an EEG tracing. |
Each filter is named with a number called the “cutoff” frequency. This number designates the frequency at which there will be a 30% reduction in amplitude (3-dB attenuation) as compared to 100% amplitude at 10 Hz. With an HFF of 15 Hz, the amplitude of 15-Hz activity will be reduced by 30%. Recording activity faster than 15 Hz will show more reduction or total elimination. When recording slower frequencies, there will be less or no reduction. The LFF filters are demonstrated on the left side of the diagram. If an LFF of 0.5 Hz is being used, there will be a 30% amplitude reduction of 0.5-Hz activity (0.5 is the cutoff frequency). Slower frequencies will have more amplitude reduction and faster frequencies will have less reduction. Notice that neither set of filters affects the frequency of 10 Hz. The available “cutoff” frequencies for the HFF (low-pass filter) are usually 15, 35, and 70 Hz and for the LFF (highpass filter) are 0.3, 0.5, 1.6, and 5 Hz, and they are determined by the manufacturer. Adjustment of the filters (HFF or LFF) will not change the frequency of the recorded activity. It will change the amplitude only.
 FIGURE 2-8 | Frequency response curves. Note 30% amplitude reduction at each low or high “cutoff” frequency. |
Filter settings are sometimes expressed in terms of “time constant” (TC). TC, as it relates to the LFF, is defined as the time it takes for a calibration signal to decay by 63% from full scale (Fig. 2-9). Relating to an HFF, TC refers to the time it takes for the calibration to rise to 63% of its total amplitude. Both high- and low-filter settings relate to the functions of resistance (Ohm) and capacitance (Farad). In a low-filter circuit as shown in Figure 2-10A, low-frequency activity is blocked because the impedance of the capacitor increases as the frequency decreases. In an HFF, the position of the resistor and the capacitor is reversed (Fig. 2-10B). This attenuates the high-frequency activity because the impedance of the capacitor decreases as the frequency increases. TC relates resistance and capacitance mathematically by the equation TC = R × C [e.g., resistance of 1 mega ohm (106 Ω) and capacitance of 1 µF (10-6 F) gives TC = 1 s]. The values of TC and filter (F) setting are inversely related by the equation of TC = 1/(2πF) (see Chapter 3, Frequency response of high and low filters, for further detail). Although the “time constant” applies to both HFFs (rise TC) and LFFs (decay TC), it is conventionally used for the LFF control. TCs of 0.03, 0.1, 0.3, and 1.0 s, for example, are equivalent to LFF of 5.3, 1.6, 0.53, and 0.16
Hz, respectively (Fig. 2-8). It should be noted that the longer (greater number) the TC, the lower (smaller number) the lowfilter setting.
Hz, respectively (Fig. 2-8). It should be noted that the longer (greater number) the TC, the lower (smaller number) the lowfilter setting.
Related posts:

Stay updated, free articles. Join our Telegram channel

Full access? Get Clinical Tree


