Fig. 23.1
Cyclosporine-induced PRES. Axial FLAIR (a–c) and SWI (d) MR images show cortical and subcortical hyperintensity within the posterior frontal lobes, parietal lobes, and occipital lobes. In addition, there is an associated large right parieto-occipital intraparenchymal hematoma within the right parieto-occipital region (arrows)
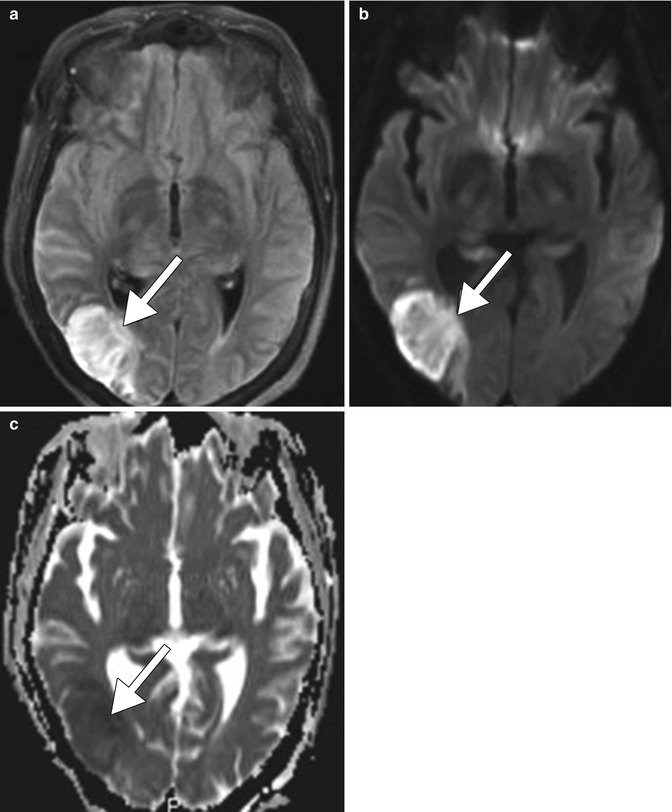
Posttransplantation lymphoproliferative disorder (PTLD) includes various forms of lymphoid hyperplasia and lymphoid neoplasia that occur in the setting of chronic immunosuppression, including with the use of calcineurin inhibitors, after solid organ transplantation. Most cases of PTLD are of B-cell origin and associated with Epstein-Barr virus infection. The incidence of PTLD ranges from 1 to 10 % of transplant recipients, depending on the organ transplanted and the type and duration of immunosuppressive therapy. PTLD occurs more frequently in children than in adults, but tends to be more severe in adults. CNS PTLD most commonly appears as focal lobar enhancing masses that display restricted diffusion and surrounding edema (Figs. 23.2 and 23.3). Subdural lesions have also been reported. Involvement of the head and neck most commonly presents as focal masses in the Waldeyer ring and lymphadenopathy (Fig. 23.4). The lymphadenopathy can manifest as large nodal masses or an excessive number of lymph nodes that are relatively normal in size. The Waldeyer ring lesions often display central necrosis and submucosal extension into the parapharyngeal space. The main treatment for PTLD is reduction of the immunosuppressive therapy.
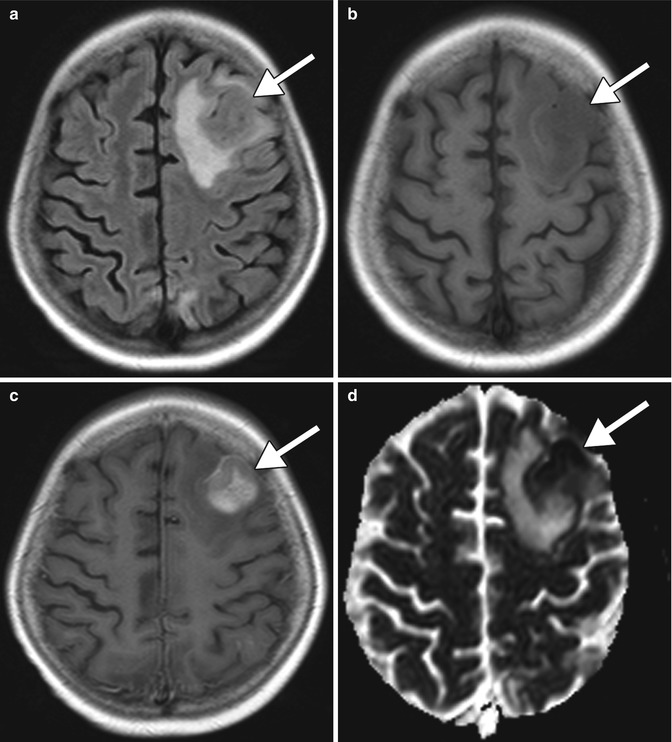
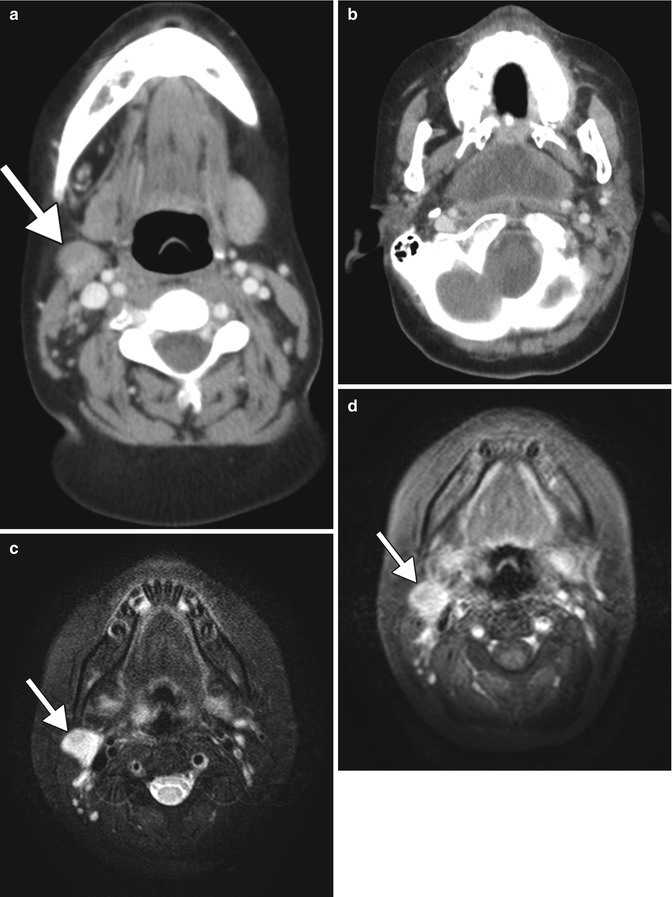
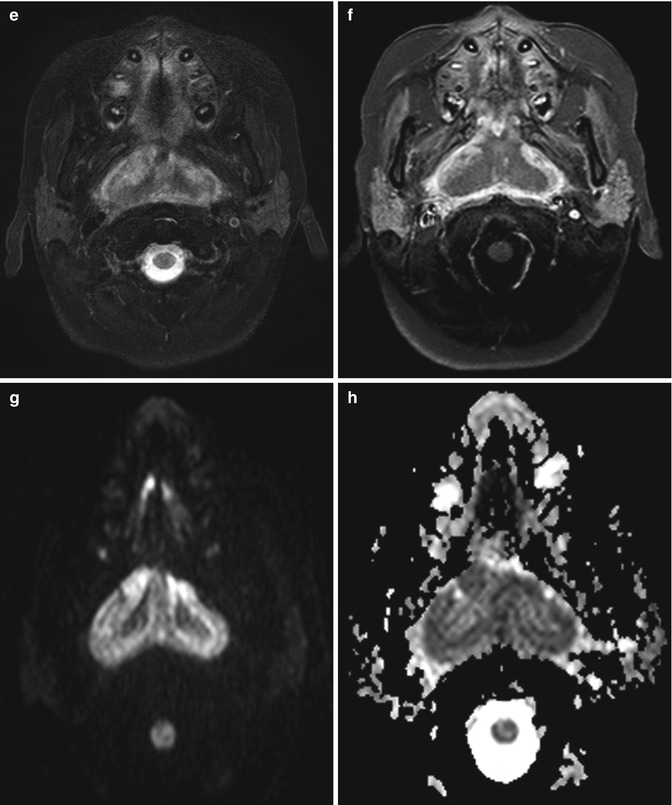
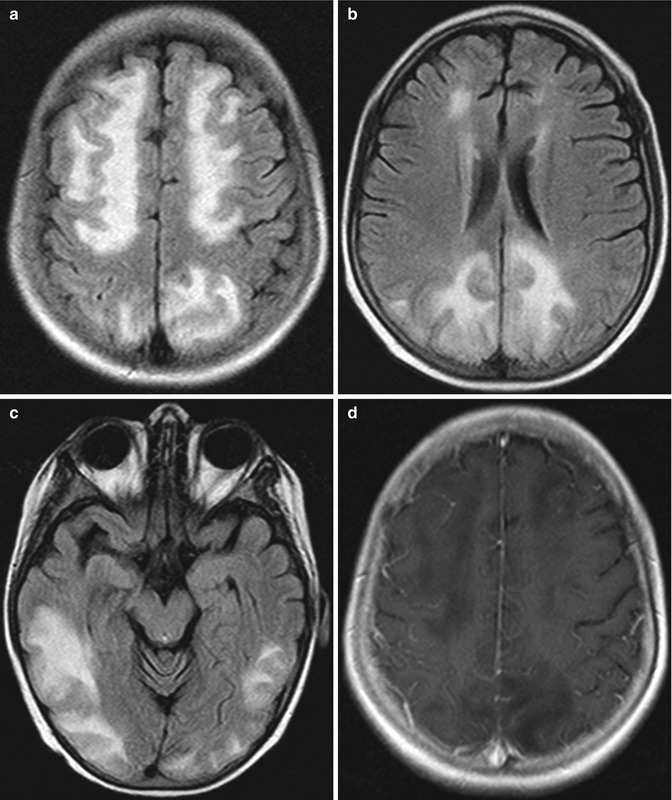
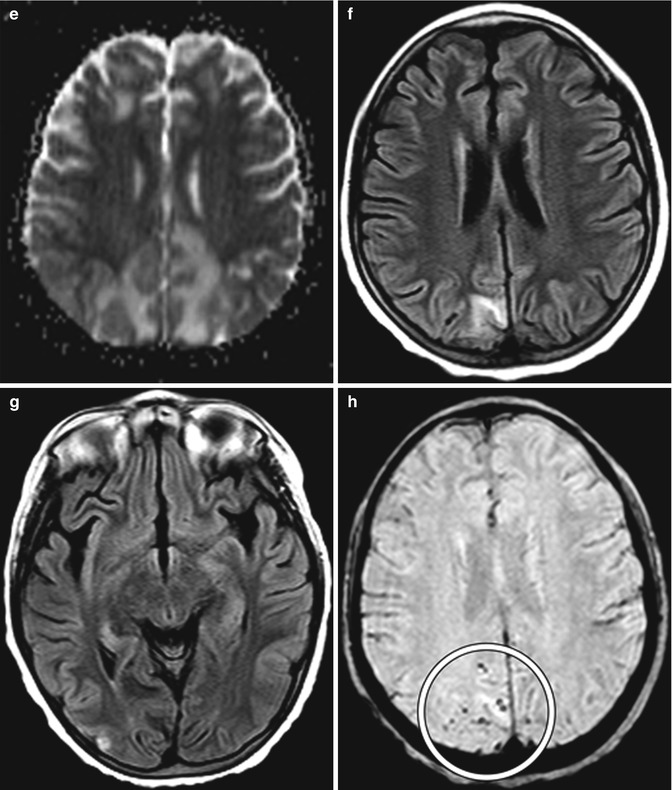

Fig. 23.2
CNS PTLD. Axial FLAIR (a), T1-weighted (b), and post-contrast T1-weighted (c) images show enhancing lesions in the left frontal lobe with surrounding edema (arrows). ADC map (d) shows restricted diffusion in a portion of the lesion (arrow)


Fig. 23.3
PTLD of the head and neck associated with calcineurin-inhibitor use. The patient received immunosuppressive therapy after bone marrow transplantation and developed neck swelling. Axial CT images (a, b) show right cervical lymphadenopathy (arrow) and a nasopharyngeal mass with central low attenuation. Axial T2-weighted (c) and fat-suppressed post-contrast T1-weighted (d) MR images show that the abnormal lymph node demonstrates high T2 signal and enhancement (arrows). Axial T2-weighted (e) and fat-suppressed post-contrast T1-weighted (f) MR images show heterogeneous signal and enhancement of the bulky nasopharyngeal mass. DWI (g) and ADC map (h) show diffusion restriction within portions of the nasopharyngeal lesion


Fig. 23.4
PRES secondary to high-dose combination chemotherapy. Axial FLAIR MR images (a–c) demonstrate symmetric areas of hyperintensity involving the cortex and subcortical white matter of the paramedian frontal, parietal, and occipital lobes as well as the posterior temporal lobes. There is no evidence of associated abnormal enhancement on the post-contrast T1-weighted MRI (d). However, there is elevated diffusivity in the affected areas shown on the ADC map (e). The MRI obtained 4 months later (f–h) shows marked involution of the edema and a few residual punctate foci of hemorrhage in the previously affected sites (encircled)
23.4 Differential Diagnosis
Differential considerations for CNI-related PRES include other etiologies of PRES: hypertension, other drugs, toxemia of pregnancy, as well as other non-PRES cortical/subcortical signal abnormalities. PRES has been associated with several other conditions including hypertension, preeclampsia/eclampsia, and other pharmaceuticals and drugs, such as combination high-dose chemotherapy (Fig. 23.4), cisplatin, bevacizumab, triple-H therapy, and cocaine (also refer to Chaps. 6 and 9). Infarction can be distinguished from PRES where there is involvement of a discrete vascular territory and the presence of steno-occlusive lesions with decreased perfusion. Seizures can present as areas of cortical and subcortical T2 hyperintensity and there can be associated restricted diffusion due to cytotoxic edema (Fig. 23.5).
