Cellular Imaging of Epilepsy
Andrew J. Trevelyan
Rafael M. Yuste
Introduction
We are at the start of an imaging revolution that is transforming our view of the brain. The techniques and technology continue to develop, and the benefits are self-evident when studying such a complex network phenomenon as a seizure. Indeed, the complexity of epileptiform activity and our inability to record it with sufficient detail at an appropriate temporal and spatial resolution have been major obstacles to progress in the field. Imaging permits detailed measurements (e.g., membrane potential or calcium [Ca2+] dynamics) to be made at many locations simultaneously, and it has already proved a significant adjunct to traditional electrophysiologic recordings.
Our main goal in this chapter is to present the possibilities that imaging affords, with a focus on imaging neural activity. We start with a brief description of some of the tools of the trade. We then provide an overview of various imaging techniques and their relevance to epilepsy, and we finish with some thoughts on possible future research.
Imaging Hardware
Technological developments have both fed and driven the burgeoning field of imaging in biology. It is tempting to draw comparison with how developments in making lenses fuelled new ways of looking at nature (both literally and metaphorically) at the start of the scientific revolution in the seventeenth century.
Key among these recent developments is the continual improvement in light sensors and cameras. The importance of the camera is obviously in part to make a permanent record of the biology, but also to record things that are not necessarily visible to the naked eye. There are two facets to this—enhancement of the view, which involves creating an image from light that lacks sufficient contrast or has spectral characteristics beyond visible light (e.g., infrared [IR] or ultraviolet [UV]); and intensification, which involves boosting the signal when the light levels are too low, which is especially important in fluorescence microscopy because it permits much less intense illumination of the specimen.
Most imaging today involves recording fluorescent emissions. There are three main options—epifluorescent, confocal, and two-photon microscopy (TPM). Of these, epifluorescent microscopy has been the most conventional and affordable. Its limitation is that the signal of interest, located at the plane of focus, is contaminated with fluorescence from molecules above and below this plane. Consequently, the signal-to-noise level is low, necessitating intense illumination to improve the signal. The intensity of illumination is a severe problem because it causes photobleaching and phototoxicity. Furthermore, these effects occur throughout the path of illumination.
This problem is partly solved by confocal microscopes. The key feature of these microscopes is a pinhole at the confocal plane (the plane of focus of the image located at the other side of the objective lens to the specimen; the pinhole effect also can be achieved with a tilting mirror) through which both the illumination and the fluorescent emission have to pass. Thus, any fluorescence emission from molecules out of the plane of focus will fail to pass back through the pinhole. Consequently, the only signal arises from the focal plane. This is known as focal sectioning. Focal sectioning provides a much-improved signal-to-noise ratio and thus permits lower illumination. Unfortunately, there is still photobleaching and phototoxicity in the path of illumination.
Two-photon microscopy (TPM) produces the least photobleaching and phototoxicity because the excitation of the chromophore occurs at a single point in the plane of focus. The essential physics for understanding TPM is that if a fluorescent molecule can be activated by a single photon at a given wavelength, then it can also be activated by the near-simultaneous absorption of two photons of approximately double the wavelength. However, the intensity of light required to get two photons to hit the same molecule is staggeringly high and is only achieved at the focal point with illumination using a pulsed laser.
The benefit of illumination with long wavelengths (roughly twice the wavelength for two-photon excitation) is that the light is less scattered and consequently penetrates tissue much better, causing less damage as it passes through. One can therefore monitor activity far deeper into slices and, crucially, perform in vivo imaging. This ability is further aided by the fact that fluorescence occurs at a single point, and so all emissions, no matter how scattered, can be attributed to that point. Indeed, it was possible to image dendritic spines on pyramidal cells in vivo without even doing a craniotomy.15
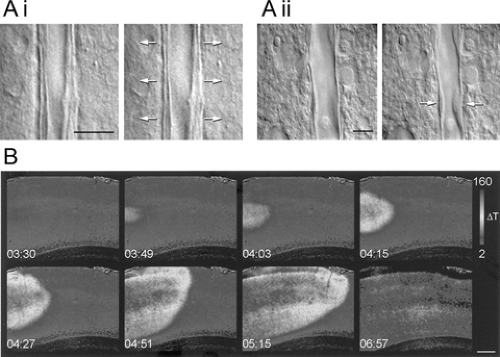 FIGURE 1. Imaging without stains. A: Regulation of vascular tone by interneuronal activity. Differential interference contrast images of microvessels before and after electrical stimulation of (i) a vasoactive intestinal peptide (VIP)-positive interneuron and (ii) a somatostatin-positive interneuron. The stimulated interneurons were not in the field of view but were characterized electrophysiologically and, post fixing, with immunocytochemistry. (From Cauli B, Tong XK, Rancillac A, et al. Cortical GABA interneurons in neurovascular coupling: relays for subcortical vasoactive pathways. J Neurosci. 2004;24(41):8940–8949; with permission.) B: Spreading depression in a neocortical slice viewed using intrinsic optical imaging. The spreading depression was triggered by perfusion of 100 μM ouabain. (From Basarsky TA, Duffy SN, Andrew RD, et al. Imaging spreading depression and associated intracellular calcium waves in brain slices. J Neurosci. 1998;18(18):7189–7199; with permission.) |
One further use for TPM is laser uncaging of various biologically active species (e.g., glutamate and Ca2+).
The main drawback of TPM is the slow rate of imaging acquisition. Because only one point is being illuminated at any given time, to get an extended two-dimensional image, the laser has to be scanned through the whole field of view. This usually takes about 1 second, which is clearly a serious impediment when trying to monitor rapidly evolving network activity. Recently, however, the problem of slow image acquisition has been solved in three different ways. The first involves splitting the laser beam into multiple beams.14 There is a cost in signal-to-noise ratio and possibly spatial resolution and depth of imaging (due to scatter of emitted light), but the potential benefit is, in principle, a doubling in imaging rate each time the beam is split. The second solution is to direct the laser only to those points in the field of view that are of interest. For instance, one maps the location of the neuronal somas with an initial scan, and then directs the laser only to those points.20 The resulting laser trajectory is a fraction of that in normal raster mode. A
third option is to use acoustooptic scanners, which could be as much as 1,000 times faster than mechanical scanners.17
third option is to use acoustooptic scanners, which could be as much as 1,000 times faster than mechanical scanners.17
It is important to remember that all modes of imaging entail photobleaching and phototoxicity, the only difference being one of degree. Thus, there is a general overriding principle that applies to all imaging methods: To optimize the protocol so as to reduce the illumination intensity to a minimum. This demands an understanding of the nature of the biological phenomenon being studied and the properties and sensitivity of the tools being used to examine it. Out of necessity, we have given a narrow and simplistic view of the field, and we encourage interested readers to consult more-specialized texts.10,13,16,37
Nature of Cellular Imaging
In the following sections we cover the main techniques used to study neural activity. We also introduce some techniques that, although not yet applied to epilepsy, show promise for future research.
Floyd Bloom wryly noted that “the gain in brain lies mainly in the stain.” Certainly our ability to visualize and understand biology has been transformed by green fluorescent protein (GFP), Ca2+ dyes, and many other labeling methods, and we discuss these in due course. It should be remembered, however, that there are also means of observing brain processes that do so without the potential invasiveness of loading the tissue with dye.
Imaging Without Stains
Brain tissue is not colored, but cells (either isolated or in slices) can be visualized using differential interference contrast (DIC) imaging. In slices, the view is limited effectively to the soma and dendritic stems of neurons, but this has proved to be an excellent way of visualizing neurons for patch clamping. Blood vessels are also easily seen, permitting a beautiful demonstration of the interaction between interneurons and the vasculature (Fig. 1A).6
A similarly simple technique is intrinsic optical imaging— the recording of subtle changes in reflectance of the tissue (see Chapter 86). The reflectance changes are secondary to neural activity and are thought to arise from changes in cellular volume and, for in vivo studies, changes in blood flow and hemoglobin oxygenation. In vivo intrinsic imaging has been used to show a prominent inhibitory annulus surrounding a neocortical ictal focus during interictal events and a preceding inhibition in advance of a propagating wave.27 In vitro imaging of slices has demonstrated activity-induced swelling of neurons,2 swelling of astrocytes secondary to potassium (K+) uptake,22 spreading depression5 (Fig. 1B), and ischemic depolarization.4 The limitation of the technique is that it gives only an indirect measure of activity recorded on a relatively slow time scale, but on the plus side, it provides large-scale views of neuronal activity without indicator dyes.
Finally, a handful of biological molecules autofluoresce when illuminated at the appropriate wavelength.36 Probably the most useful of these is the reduced form of nicotinamide adenine dinucleotide7(NADH) (other examples include retinol, indoleamines, and collagen), the oxygenated form of which (NAD+), does not fluoresce. Thus, changes in NADH autofluorescence reflect shifts in the ratio of NADH to NAD+, which in turn reflect the metabolic state of the cell.7
Seizure-like activity or persistent stimulation in vitro causes an initial drop in NADH fluorescence (trough at around 10 seconds) followed by a subsequent overshoot peaking at around 60 seconds.21 A further in vitro study, using GFP and immunofluorescently labeled astrocytes, identified the early flux as arising from oxidative metabolism in neuronal dendrites, whereas the late rise in NADH occurred in astrocytes (rich in glycolytic enzymes but poor in mitochondria).19 There is, however, one significant caveat to this interesting metabolic relationship between neurons and glia: Experiments in vivo fail to show the late rise in NADH fluorescence unless the local blood supply is impaired.18 It seems that in the normal brain, any oxygen debt incurred by neuronal activity is more than offset by an increased supply of oxygen through dilated blood vessels.
Related posts:


Stay updated, free articles. Join our Telegram channel

Full access? Get Clinical Tree


