MACROSTRUCTURAL CHANGES IN NORMAL AGEING DETECTED WITH CONVENTIONAL MRI
Conventional brain structural magnetic resonance imaging (MRI) produces images of protons, with contributions primarily from water and some from fat. Tissue contrast is possible because of the fundamental differences in water content in the primary tissues of the brain: white matter consists of about 70% water, grey matter 80% and cerebrospinal fluid (CSF) 99%. Tissue contrast also depends on differences in the degree to which water is bound and differences in the local environment. By judicious choice of imaging acquisition parameters that yield high conspicuity between grey and white matter (e.g. Figure 4.1a), segmentation of brain tissue is possible. Segmentation provides the basis for volumetric and morphological quantification of brain structure1,2. In addition to manual delineation of specific structures, methods for quantitative survey of the brain include voxel-based morphometry, as is widely used with spatial parametric mapping (SPM)3,4, parcellation2,5 and deformation morphometry6-8. The achievement of quantitative analysis was an essential step for rendering MR images useful in the quest for reliable identification of age-related macrostructural change.
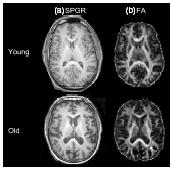
Figure 4.1 (a) Structural magnetic resonance imaging (spoiled gradient recalled, SPGR), and (b) diffusion tensor imaging (fractional anisotropy, FA) images from a young (32 year old) and an elderly (73 year old) male volunteer. SPGR images exemplify those that yield conspicuity between grey and white matter permitting brain tissue segmentation. Fractional anisotropy images facilitate fibre tracking
In vivo structural MRI reveals age-related increases in the volume of CSF-filled spaces primarily at the expense of cortical grey matter (cross-sectional9-14, longitudinal15-19).
Despite evidence for widespread thinning of the cerebral cortex as a feature of normal ageing16,20,21, specific grey matter structures of the brain exhibit differential patterns of ageing. A preponderance of data indicates an excessive vulnerability of the frontal lobes, and in particular the prefrontal cortex, as documented cross-sectionally22-25. Other grey matter structures demonstrating cross-sectional decline in volume with age include, but are not limited to, segments of the temporal20,25 and parietal cortices20, thalamus12,26, and cerebellum11,21,27. Longitudinal studies, although less frequently reported, support cross-sectional results by revealing disproportionate effects of age on frontal grey matter regions15,17,28, entorhinal28,29, temporal17,28, parietal17 cortices, and cerebellum21. Some30, but not all27,31 MRI studies of subcortical structures report little shrinkage of basal ganglia structures. Similarly, although some reports are equivocal16,28,32, it is generally accepted that hip-pocampal volume shrinks little with age20,33,34. That hippocampal volume shrinkage is not a reliable marker of healthy ageing makes it a robust marker of age-related diseases affecting this structure, notably, Alzheimer’s disease.
The relevance of structural MRI findings to age-related decline in function is underscored by correlations with selective behaviours. For example, smaller prefrontal volume predicts poorer performance on the Wisconsin Card Sorting test35 and other tasks involving inhibitory control36,37. Deficits in the working memory that occur in normal ageing correlate with frontal system volume38, whereas episodic memory deficits that occur in Alzheimer’s disease correlate with medial temporal lobe/hippocampal volume39-41. Such findings support a double dissociation between normal ageing and Alzheimer’s disease: frontal brain volume reductions and executive dysfunction mark normal ageing, whereas volume reductions in the medial temporal lobe/hippocampus and the corresponding memory deficits indicate Alzheimer’s pathology20,42,43.
MICROSTRUCTURAL CHANGES IN NORMAL AGEING DETECTED WITH DTI
Whole-brain white matter volume shrinkage is small, estimated at no more than 2% per decade27 (but see 31,44). Yet postmortem investigations, in contrast to macrostructural approaches, have provided fruitful leads to age-related changes in white matter by revealing microstructural white matter compromise45 including degradation of microtubules, myelin and axons46-48. In vivo, white matter microstructure is detectable with DTI, which has successfully revealed evidence of regional white matter disruption in normal ageing even in regions appearing normal on bulk volume imaging.
Quantification of DTI Data
Water molecules in the brain are in constant Brownian motion. Although movement of water protons affects conventional structural imaging to some degree, DTI allows quantification of this microscopic movement within each voxel, providing a depiction of local water molecular movement in terms of the preferred orientation of the motion. Along a white matter fibre, the path of a water molecule is constrained and this movement is called ‘anisotropic’, because diffusion along the long axis of a fibre (axial diffusion) is greater than diffusion across the fibre (radial diffusion49). Conversely, regions with few or no constraints imposed by physical boundaries such as CSF in the ventricles allow water movement to be random in every direction; this is therefore ‘isotropic’. Disruption of white matter microstructure detectable with DTI can reflect compromise of cytoskeletal structure, myelin or axon density50,51.
DTI quantification requires computation of a tensor, a mathematical description of a three-dimensional ellipsoid depicting the magnitude and orientation of diffusion in individual voxels. The tensor is associated three eigenvalues, with three corresponding orientational vectors (eigenvectors, ki, k2, k3), describing the diffusion ellipsoid by its major axes. The eigenvalue average, or trace, reflects the magnitude of diffusion, referred to as mean diffusivity or the apparent diffusion coefficient. The extent to which one eigenvalue, ki, dominates the other two, k2 and k3, determines the degree of anisotropy, that is, the degree of orientational preference within a voxel, typically measured as fractional anisotropy, ranging between 0 and 1 on a normalized scale (Figure 4.1b52). The largest eigenvalue, k1, is the longitudinal or axial diffusivity, kL, and reflects axonal integrity, whereas k2 and k3 quantify transverse or radial diffusivity, kT = (k2 + k3)/2, and reflect myelin integrity49,53. For both clinical and research studies, most DTI data sets are reduced to an anisotropy image and a diffusivity image. (For more information about DTI, see54.)
Regional Quantification of DTI Data
A variety of approaches have been developed for quantification of DTI data; each has strengths and weaknesses that should be considered when critically evaluating published reports. Approaches for regional quantification of the DTI metrics of anisotropy and diffusiv-ity include manually placing small, geometric samples (cubes, ovals, circles) onto selective white matter bundles, manually identifying anatomically based regions of interest (ROI, e.g. midsagittal corpus callosum), application of whole-brain analysis using SPM or other voxel-based morphometric methods, or tract-based spatial statistics (TBSS55). Geometric ROIs have the advantage of yielding rarefied samples of white matter with minimal effects from partial voluming (i.e. inclusion of grey matter, CSF or both) but the potential disadvantage of under-representing the condition of the full extent of the fibre system under study. Manual identification of the entire fibre tract has the advantage of providing an anatomically based sample of the target fibre with the possibility of examining subdivisions for regional variation; a disadvantage can be its susceptibility to partial voluming artefact because of the extended region sampled56. Voxel-based morphometry is attractive because it provides an automated, whole-brain survey of fractional anisotropy or diffusivity, but more often than not, has the under-appreciated cost of inadequate registration6. Such misregistration can disproportionately bias results and conclusions drawn from data, especially of the elderly57, who have dilated CSF-filled spaces invading targeted white matter samples58. TBSS is another survey approach that does not actually track fibres but is used to quantify the whole-brain fractional anisotropy skeleton59.
With advancing age and senescence, a consensus maintains a decline in fractional anisotropy in brain white matter56,60-65 (but see 66,67). Furthermore, consistent evidence supports an anterior-posterior gradient of fractional anisotropy decline with age57,58,60,61,65,68-74 that has been confirmed in a monkey model of ageing75. TBSS likewise substantiates an anterior-posterior gradient, namely by identifying lower fractional anisotropy values in the frontal, parietal and temporal lobes, corpus callosum (particularly the genu and body) and the internal capsule76.
In complement to white matter fractional anisotropy decline in ageing, diffusivity in white matter increases58,65,67,77-80. As with fractional anisotropy, profile analysis reveals that the primary locus of the age effect is in anterior white matter80. This pattern of age-related decline of fractional anisotropy and increase in diffusivity mirrors postmortem observations with predominant age-related findings in anterior white matter systems45,81.
QUANTITATIVE FIBRE TRACKING IN AGEING
The degree to which the diffusion orientation of a voxel is similar to its neighbours, or in other words, coherence of diffusivity measures between voxels82,83, serves the conceptual basis for quantitative fibre tracking55,84-87. Connectivity and coherence between different brain regions on vector and fibre tracking maps is readily apparent on visual inspection88. Methods for quantitative analysis of structural connectivity of white matter include fibre-tract trajectories89-91 and maps of the degree of ‘alignment’ among neighbouring vectors, on a voxel-to-voxel basis, resulting in a measure of intervoxel coherence82. Advantages of quantitative fibre tracking over focal ROI analysis include the ability to measure the entire extent of a fibre tract and to characterize its integrity along its full extent.
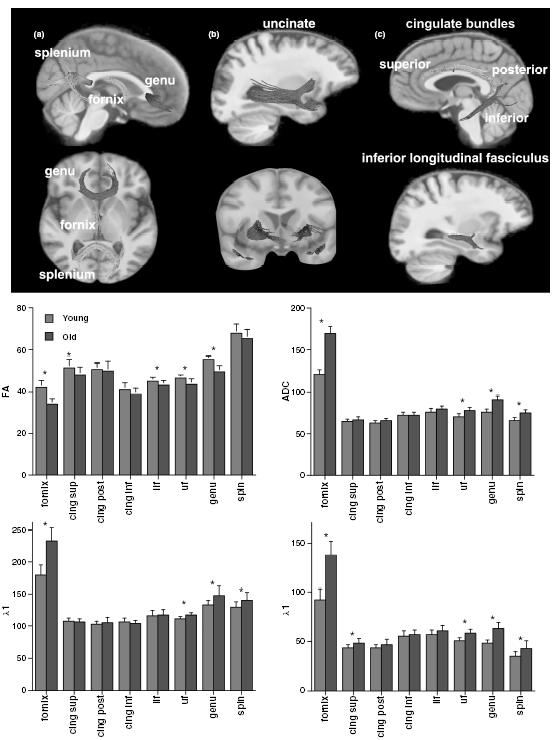
Quantitative fibre tracking confirms focal DTI measures of an anterior-to-posterior pattern of disruption of white matter integrity92,93 as, for example, the elderly have lower fractional anisotropy and higher diffusivity than the young in anterior but not posterior sectors of the fibres coursing through the corpus callosum (Figure 4.2)94-96. Recent work also supports a superior-inferior gradient of ageing effects on white matter (Figure 4.3)97-99, whereas pontocerebellar and cerebellar hemisphere white matter tracts are relatively preserved97.
Figure 4.2 Top sagittal image: Example of fibre tracking of the corpus callosum of a 23-year-old healthy woman. The colours represent six different fibre bundles based on previously described divisions148 identified with fibre tracking based on diffusion tensor imaging (DTI)-derived fractional anisotropy. From anterior (far left) to posterior (far right), the bundles are deemed prefrontal, premotor, precentral, postcentral, posterior parietal, and temporal-occipital. Bottom data figures: Mean ± SE of the six callosal sectors for the young and elderly groups at MRI sessions two years apart of the four principal metrics of DTI: fractional anisotropy, apparent diffusion coefficient (ADC), X1 and Xt. The elderly group had lower fractional anisotropy and higher diffusivity than the young group at both scanning sessions, and the group differences were greatest in anterior sectors. Reproduced with permission from Sullivan et al .105
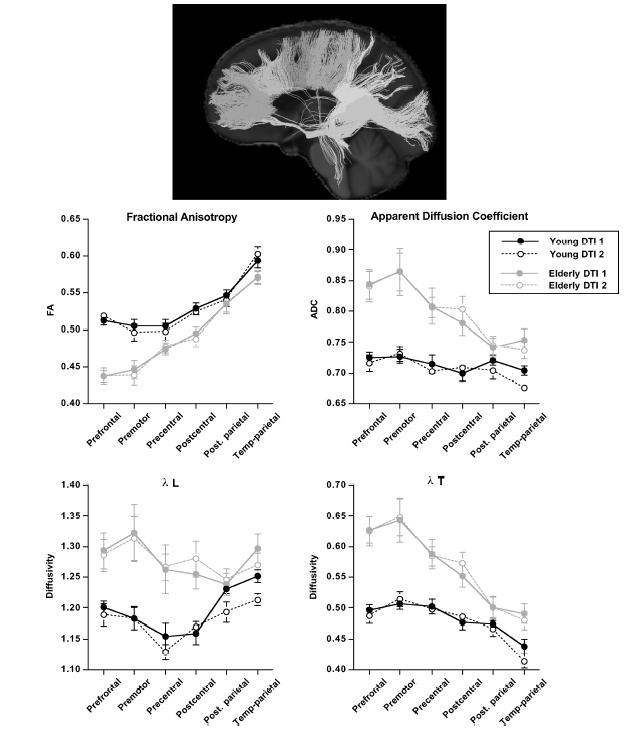
Figure 4.3 Images: Fibre tracts were identified on the group-average fractional anisotropy image in common space. (a) Sagittal (top) and axial (bottom) views of the genu, splenium and fornix. (b) Sagittal (top) and coronal (bottom) views of the uncinate fasciculus. (c) Sagittal (top) view of the cingulum (superior, posterior, inferior) and inferior longitudinal fasciculus (bottom). Bar graphs: Mean ± SD for fractional anisotropy, apparent diffusion coefficient (ADC), k1 and Xt for young (grey) and elderly (white) subjects for each fibre bundle. *P < 0.05t-test. Modified from Zahr et al .99
LONGITUDINAL STUDIES OF AGEING BRAIN MICROSTRUCTURE
Longitudinal studies of normal, healthy men and women across the adult age range document normative age-related, DTI-detectable changes in brain white matter that are requisite for interpreting DTI data from individuals with neuropsychiatric disorders and other conditions affecting the brain. However, longitudinal studies have their own problems with respect to measurement reliability within and across research centres, selective attrition, and hardware and software system modifications and drift100. For example, a study of five normal adults imaged five times each resulted in 5% across-subject variation and a mean variation of 2.3 ± 1.2 SD% in diffusivity78. Another study measured the reliability of global and regional fractional anisotropy and diffusivity measurements in ten healthy young adults, imaged three times on two different 1.5-T scanners made by the same manufacturer101. When reliability was measured on a voxel-by-voxel basis or on a slice-by-slice basis, fractional anisotropy and diffusivity values were equivalently and significantly higher within than across scanners. In addition to reliability of a common measurement approach, substantial differences can arise when different analysis schemes are applied to the same data set102.
Longitudinal DTI studies of healthy ageing are only now emerging. The few studies reporting longitudinal results in normal ageing do so secondarily, in that the target study groups were individuals with neurological conditions, including head injury103 and amyotrophic lateral sclerosis104; in neither control group were age-related declines in fractional anisotropy or increases in diffusivity detected. One small prospective study followed eight young and eight elderly individuals over two years105 but found no evidence of change in any of the six sectors of the corpus callosum examined; instead, the measurement was highly reliable across the interval (see Figure 4.2).
BRAIN WHITE MATTER STRUCTURE-FUNCTION RELATIONSHIPS
The functional ramifications of the DTI metrics have been regularly verified with observations of correlations between regionally specific low fractional anisotropy or high diffusivity and poor cognitive61,62,71-73,106,107 or motor68 test performance in humans and also a monkey model of ageing75. Lower whole-brain fractional anisotropy and higher mean diffusivity correlated with working memory performance106,108. The alternating finger-tapping task, a test of interhemispheric information transfer, revealed a relationship between splenium and parietal pericallosal white matter fractional anisotropy and finger-tapping output that was selective to the alternating condition, requiring interhemispheric motor coordination, and not unimanual conditions, free of transcallosal information exchange68. Task switching61,109 and lower scores on tests of executive functions63,109 correlated with low fractional anisotropy and greater diffusivity in anterior brain regions; lower verbal fluency scores correlated with lower fractional anisotropy in central samples of white matter61.
Functional correlates of regional fibre tracking are also emerging. Correlations between fibre tracking quantification and the Stroop color-word reading were noted94. A large, multifactorial battery of neuropsychological tests reduced to three factor scores revealed that problem solving and working memory factor scores correlated with indices of callosal genu and fornix integrity, whereas the motor factor score correlated with a widespread set of fibre systems, likely reflecting the multiple brain loci required to execute the tasks, which included speed, dexterity and choice reaction time (Figure 4.4)99.
DTI studies indicate widely varying fractional anisotropy across brain regions, with lower anisotropy and higher in diffusivity in older than younger healthy adults, that is prominent in the anterior supratentorial white matter but minimal to none in posterior cortical and corticospinal tracts. A caveat to this generalization is that selective deletion of uniformly orientated white matter fibres from a tissue sample of crossing fibres, as can occur with Wallerian degeneration, can cause abnormally high anisotropy110. Therefore, interpretation of fractional anisotropy results requires guidance by knowledge of the underlying regional architecture, especially white matter111 and supplemented with non-human primate studies, affording the opportunity for in vivo examination and postmortem verification of imaging results (cf.88).
Furthermore, the diameters of axons, for example in the corpus callosum ranging from 0.4 to 5μm, with most less than 1μm, means that a cross-section of the genu of the human corpus callosum contains approximately 400 000 fibres per mm2 and a single DTI voxel using relatively high resolution (2 × 2 × 2 mm3) for current standards could contain 1.6 million fibres in a cross-section112. Consequently, caution must be used when interpreting the anatomical meaning of observations made with radiological measures, which are coarse on the size scale of the underlying fibres.
Finally, the diffusion-weighted signal can also be influenced by iron accumulation with age, and the resulting effect is different among deep grey matter structures and white matter and needs to be considered, especially when using DTI to characterize structures known to accumulate iron (in vivo113, postmortem114) or in conditions, such as stroke, that produce high ferritin deposition (cf.115).
Related posts:
 The Care Home Experience Alisoun Milne
 The Informant Questionnaire on Cognitive Decline in the Elderly (IQCODE) Nicolas Cherbuin andAnthony Francis Jorm
 The Lundby Study Mats Bogren, Cecilia Mattisson and Per Nettelbladt
Environmental Factors, Life Events and Coping Abilities Toni C. Antonucci and James S. Jackson
The Multidisciplinary Team and Day Care Provision Martin Orrell and Kunle Ashaye
The Lundby Study Mats Bogren, Cecilia Mattisson and Per Nettelbladt
Environmental Factors, Life Events and Coping Abilities Toni C. Antonucci and James S. Jackson
The Multidisciplinary Team and Day Care Provision Martin Orrell and Kunle Ashaye
 Training Requirements for Old Age Psychiatrists in the UK Susan Mary Benbow and Aparna Prasanna
Stay updated, free articles. Join our Telegram channel

Full access? Get Clinical Tree


