Alarm
Threshold value
Heart rate
<50 or >100 beats per minute
Systolic blood pressure
<90 or >160 mmHg
Respiratory rate
<10 breaths per minute
Pulse oxygenation
<92%
Intracranial pressure
>20 cm H2O
Central venous pressure
<6 or >12 cm H2O
Typically, individual alarms are triggered based on data from a single sensor or device. The opportunity in advanced programmable monitoring systems is to customize alarms by interrogating multivariate signal data for alarm processing that is better suited to the unique health condition of a specific patient. Further, there is a significant opportunity by moving from simple threshold-type alarms to alarms based on more complex features that are extracted from the real-time physiological waveform data being collected. Computational analysis can then be applied to the actual physiologic waveforms captured at the bedside and analyzed in real time to compute indicators such as heart rate and respiratory variability indices, oxygen saturation trends, and statistics that can provide further information in detecting a change in a patient’s condition, as well as providing important clinical information of a patient’s trend toward an improved or deteriorating condition.
6.2.3 Physiologic Data
There are two types of physiological data—numeric data and continuous waveform data. Numeric data may or may not be captured continuously or have an associated waveform. Numeric data may often be measured at discrete, often hourly time intervals such as cuff blood pressure readings, body temperature, or mean flow velocities in blood vessels from bedside transcranial Doppler studies.
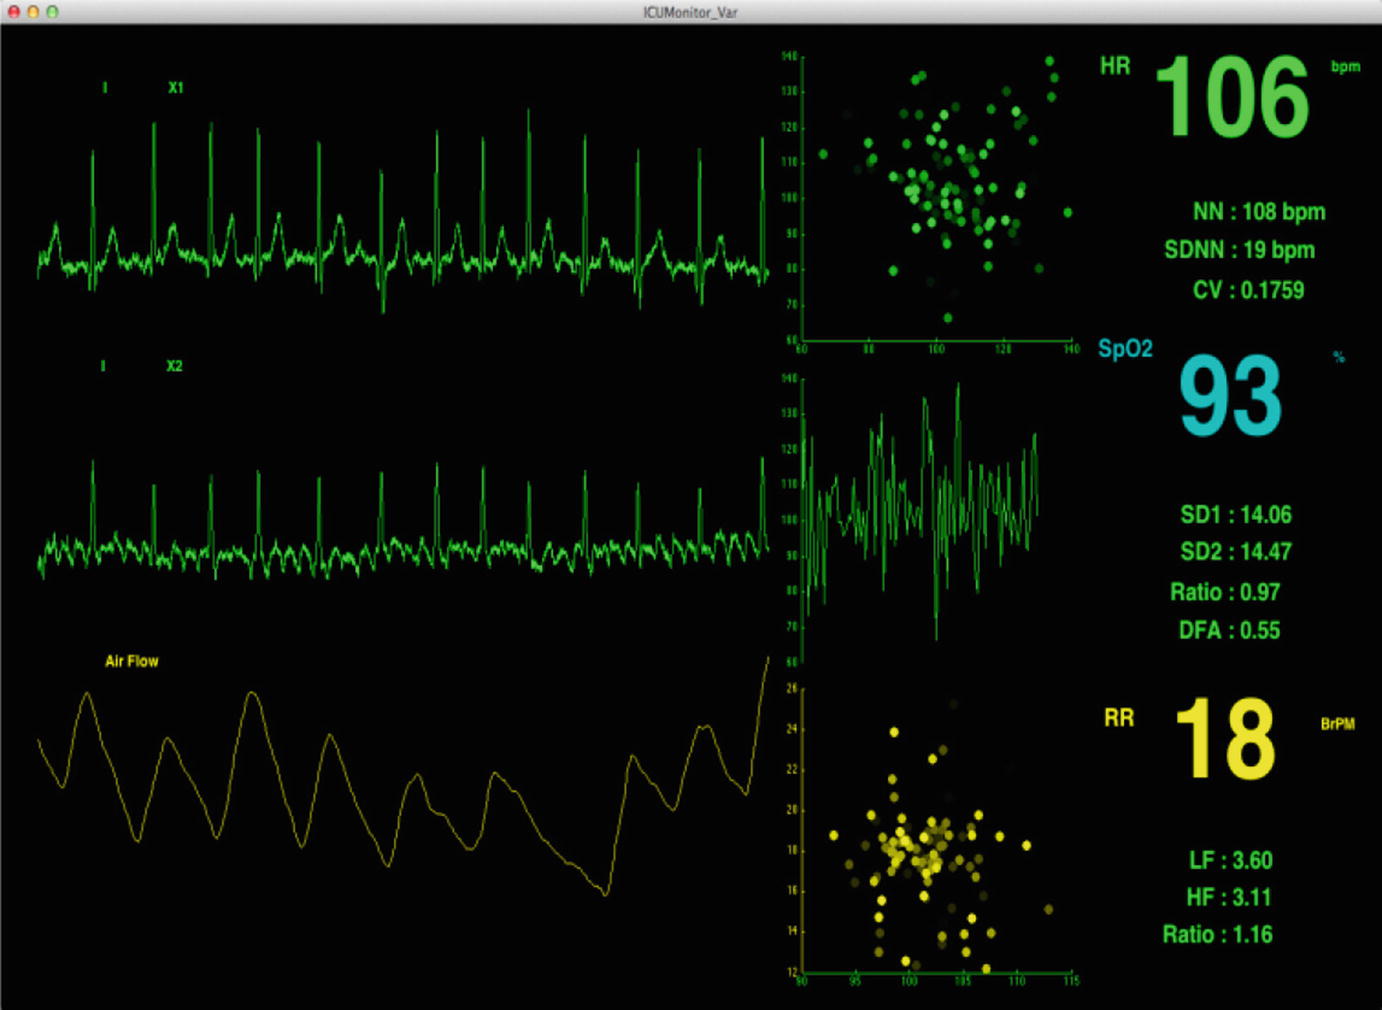
Display for continuous waveform data
6.3 Types of Physiologic Data in the ICU
6.3.1 Core Body Temperature
The anterior hypothalamus determines the set point of core body temperature, which varies 0.5 °C around the mean of 37 °C. Core body temperature may be measured via esophageal, urinary, or rectal probes. Esophageal and urinary probes can provide continuous measurements of temperature especially in patients undergoing hypothermia (cooling to <35 °C), sustained fevers (>38.3 °C), or to maintain normothermia (37 °C) in a critically ill patient.
Fever in an ICU has been associated with prolonged length of stay, increased cost of care, and higher mortality. Fever may result from an infection (sepsis) but may be related to other causes such as drug reactions, transfusion, or vasospasm patients with subarachnoid hemorrhage. Fevers can also be central, from brain injury itself.
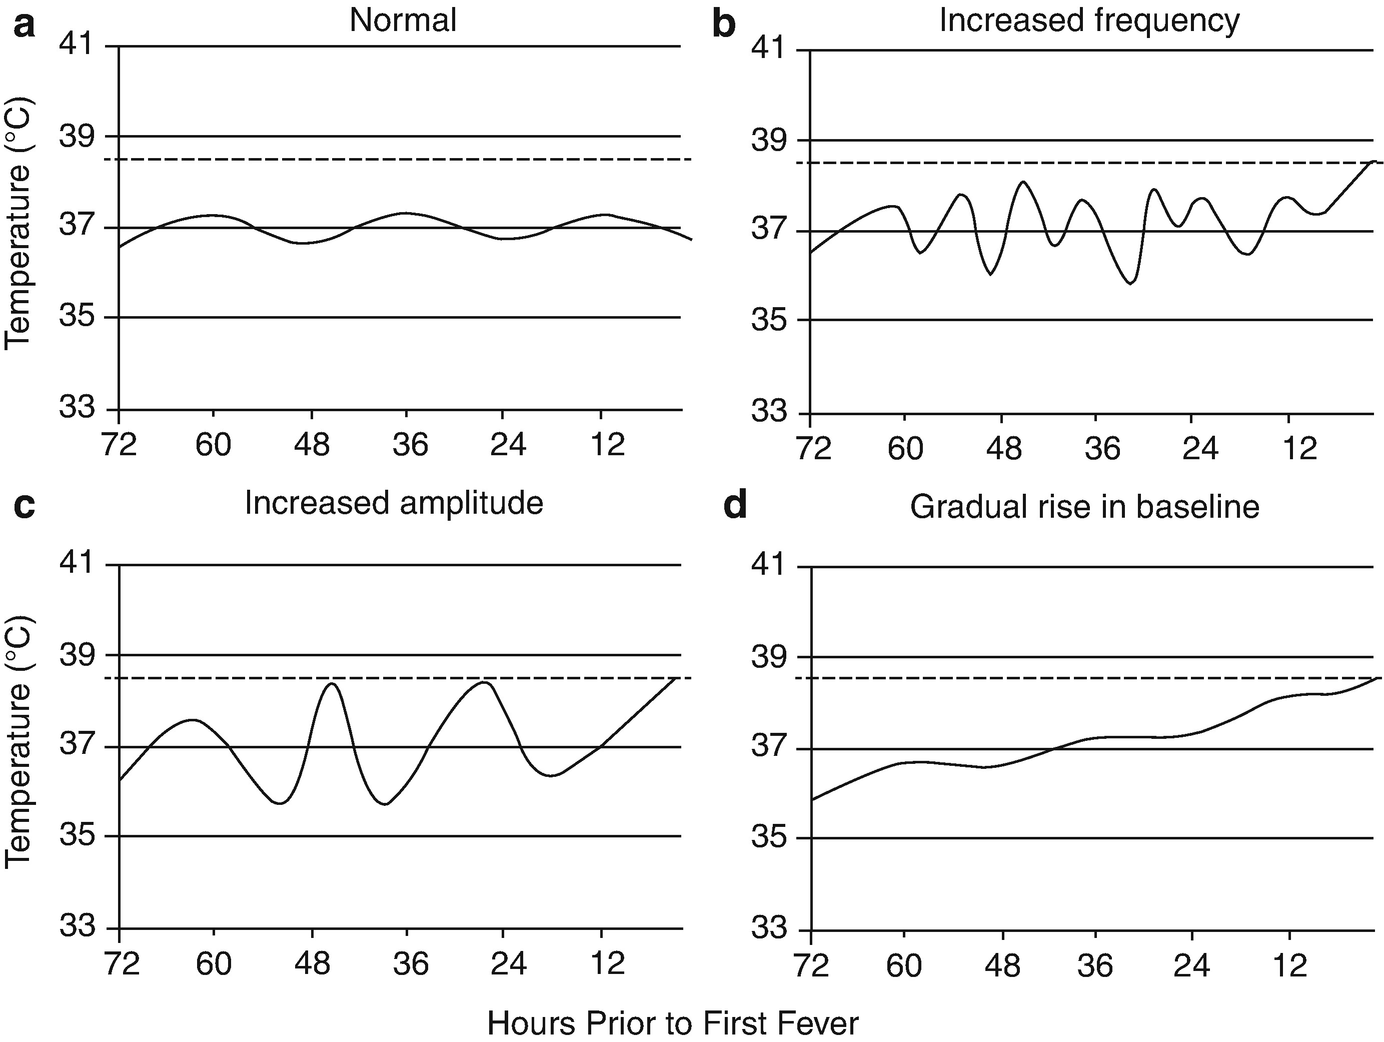
Temperature pattern abnormalities observed prior to fever in septic patients. The horizontal axes represent hours prior to the first fever in septic patients. The dotted lines denote a fever of 38.3 °C. A normal body temperature pattern fluctuates diurnally by approximately 0.5 °C around a mean of 37.0 °C (a). In septic patients, temperature patterns may exhibit increases in frequency (b), increases in amplitude (c), or changes in baseline temperature (d) during the 72h period prior to fever (Taken from Drewry AM, Fuller BM, Bailey TC, Hotchkiss RS. Body temperature patterns as a predictor of hospital-acquired sepsis in afebrile adult intensive care unit patients: a case-control study. Crit Care 2013;17:R200. https://doi.org/10.1186/cc12894 with permission from the publisher)
Variability in temperature (hypothermia or hyperthermia) can be studied in relation to variability in not only other physiologic parameters, but also clinical examination and laboratory data. Additionally, one may also study fever burden in critically ill patients in relation to morbidity, mortality, and length of stay.
6.3.2 Electrocardiogram
The electrocardiogram (ECG) is displayed on the bedside monitor as a waveform. The heart rate is derived from this waveform, and this is typically also displayed on the monitor. The ECG measures the electrical activity of the heart by bipolar and unipolar leads. Bipolar leads include leads I, II, and III. Unipolar leads include the “augmented vector” limb leads (aVR, aVL, and aVF) and six chest leads (V1–V6). This is the standard “12-lead ECG” (this actually requires the placement of ten electrodes on the body—six across the chest plus one on each limb). In the ICU, typically a 5-lead ECG is used: white electrode (RA) below the right clavicle, black electrode (LA) below the left clavicle, green electrode (RL) at the right lower chest, red electrode (LL) at the left lower chest, brown electrode at the fourth intercostal space just right of the sternum (V1). This 5-electrode ECG provides monitoring of leads I, II, III, aVR, aVL aVF, and V1.
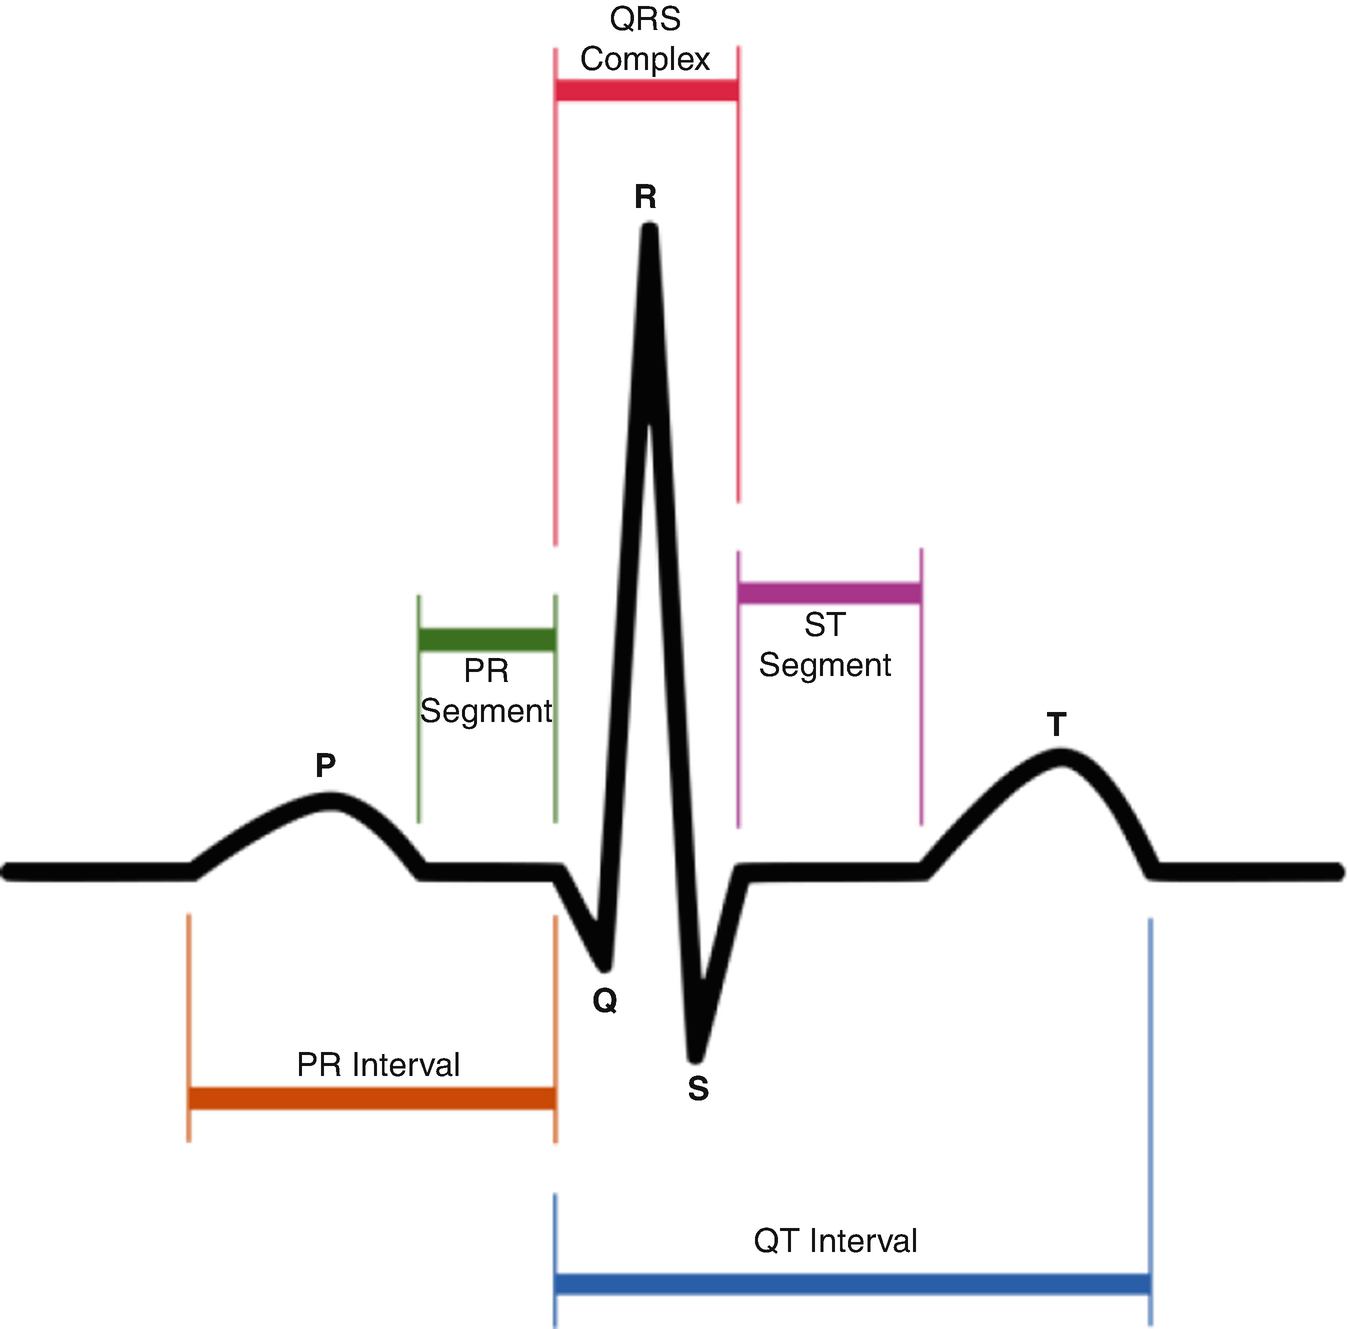
Typical ECG waveform
6.3.3 Heart Rate
Heart rate (HR) monitoring is standard in the ICU. Most monitors measure the HR using algorithms that detect the R-peak in the QRS complex (the number that appears on the monitor is typically a 3–5 s average). Normally, the HR ranges between 60 and 120 beats per minute (bpm). Alarms are set up usually for when the heart rate <50 or >120 bpm. An alarm will also be triggered during arrhythmias such has ventricular tachycardia or ventricular fibrillation.
Beat-to-beat interval measurement (in order to assess heart rate variability) is not possible with commercial monitoring systems as it requires a much higher resolution. Heart rate variability has been shown to predict adverse events in critical care [2, 3], delayed cerebral ischemia in aneurysmal subarachnoid hemorrhage [4], and increased mortality in traumatic brain injury [5] (see below).
6.3.4 Blood Pressure
Blood pressure is the pressure generated in the aorta from contraction of the left ventricle. The systolic blood pressure (SBP) is the maximum pressure in the aorta following ejection of blood from the ventricle whereas the diastolic blood pressure (DBP) is the lowest pressure in the aorta just before the ventricle ejects blood again. Palpation of the pulse has been attributed to the early Egyptians [6], but the actual recording of blood pressure began with Stephen Hales in the mid-eighteenth century [7]. The recording of SBP and DBP measured by auscultation was first reported by N.C. Korotkoff, a Russian Surgeon to the Imperial Military Medical Academy in 1905 [8]. Blood pressure, as the overall driving force of blood flow through the tissue bed, is one of the main hemodynamic parameters monitored in critically ill patients.
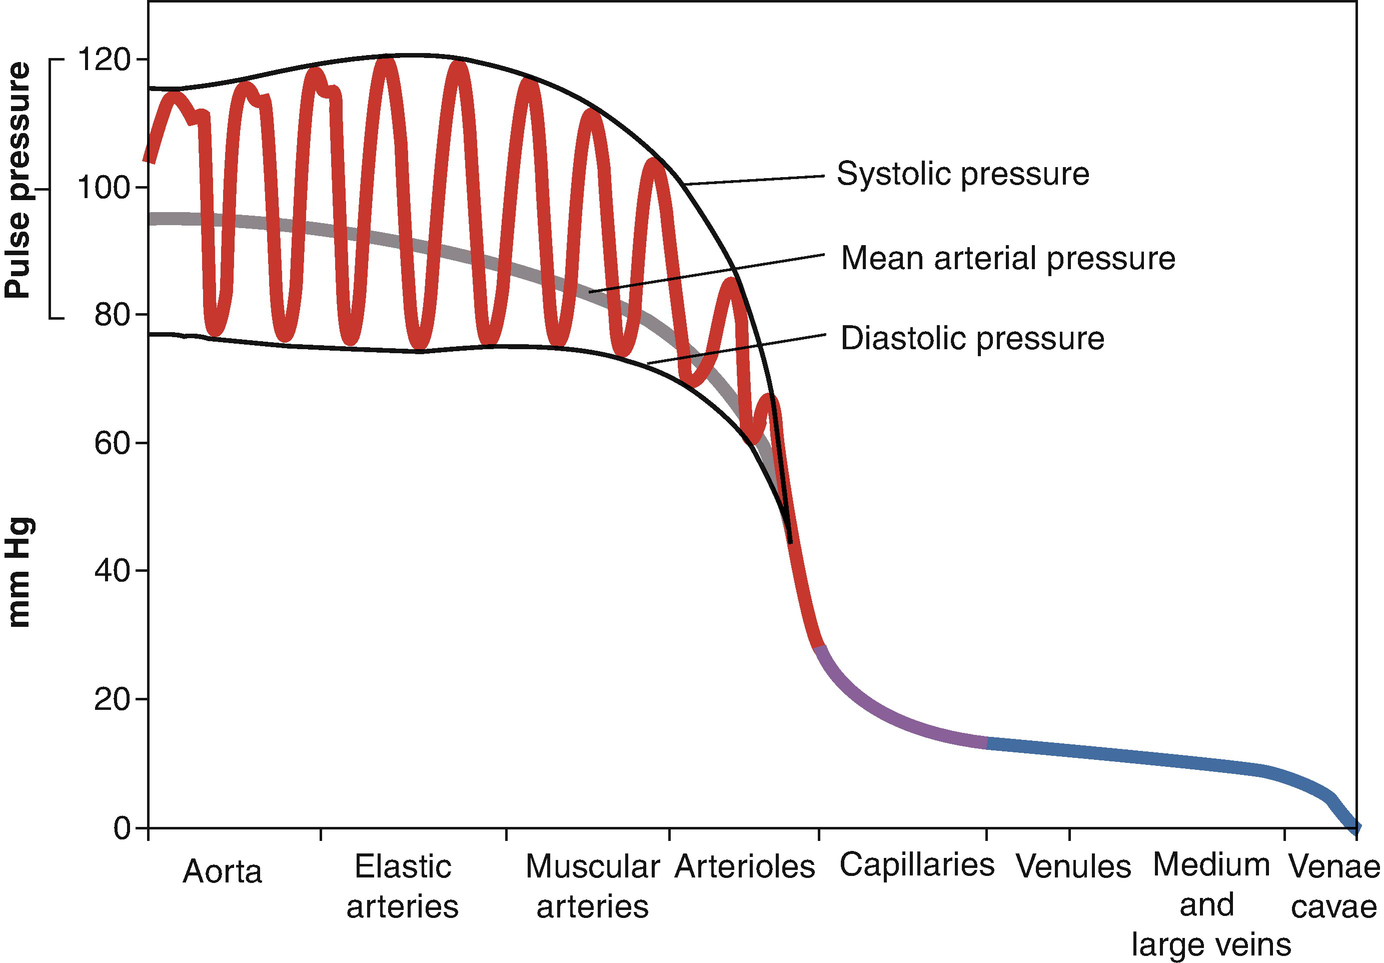
Pulse pressure
Mean arterial pressure (MAP) refers to the average pressure generated during one ventricular contraction. Using an invasive intraarterial catheter, the MAP is calculated by integrating the area under the curve of the pressure-time waveform. When blood pressure is measured by automated noninvasive systems, the MAP is calculated by the following equation: MAP = DP + 0.333(PP) [9].
Invasive arterial measurement is accomplished by inserting a cannula into a large artery (usually the radial, femoral, or axillary artery) and connecting it to a transducer [10]. The pressure wave generated by contraction of the left ventricle travels through fluid-filled incompressible tubing to a transducer and displaceable sensing diaphragm, that converts the pressure wave into a proportional electrical signal that is then amplified and digitally displayed. Despite the potential for overdamping and underdamping of the signal, invasive blood pressure monitoring is a very valuable tool and is essential for monitoring when antihypertensive, inotropic, or vasopressor drugs are being used in a critically ill patient as it allows for constant blood pressure readings to improve direct care.
The oscillometric method is typically used for noninvasive measurement of blood pressure (NIBP). With an inflated cuff, small oscillations from pulsations of the underlying artery are detected using plethysmography. Systolic and diastolic pressures can be estimated indirectly by detecting oscillations that begin approximately at systolic pressure and continue below diastolic pressure. Oscillometric blood pressure monitoring is intermittent rather than continuous, and there are slight differences in measurements when compared to invasive arterial blood pressure monitoring (oscillometric SBP measurements tend to be lower at extremely high blood pressures and higher at extremely low blood pressures) [11, 12]. Thus, intraarterial blood pressure monitoring is preferred in critically ill patients when accurate blood pressure measurements are required.
6.3.5 Central Venous Pressure
Central venous pressure (CVP) is the pressure in the superior vena cava near the right atrium. It is measured using a central venous catheter primarily inserted via the internal jugular or subclavian vein to the junction of venae cavae and right atrial junction. As an estimate of right atrial pressure (RAP) and, in theory, right ventricular end-diastolic pressure (RVEDP), end-diastolic volume (and indirectly intravascular volume), the CVP has been used to guide hemodynamic therapy.
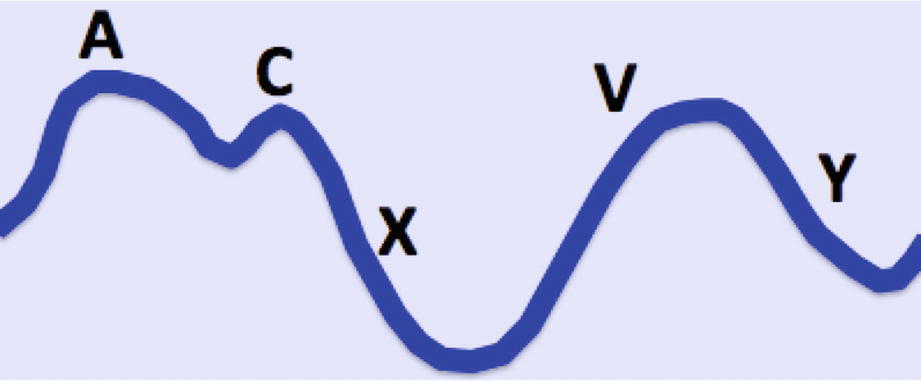
Typical CVP waveform
The normal CVP is highly variable, however, and is affected by not only intravascular volume but also patient position, venous tone, intrathoracic pressure, and cardiac valvular disease. Thus, while a normal CVP typically is thought to be 3–8 mmHg, in truth, any value between 6 and 20 mmHg could be compatible with normovolemia [13, 14].
6.3.6 Intracranial Pressure
The “gold standard” for intracranial pressure monitoring in neurointensive care requires an invasive ventricular catheter connected to an external transducer. Intraventricular and intraparenchymal catheters are available for monitoring. Continuous ICP monitoring is essential as it guides various therapies for reduction in ICP in patients due to hydrocephalus, hemispheric strokes, subarachnoid hemorrhage, trauma, or other mass occupying lesions causing edema. For a detailed reviewed of intracranial pressure, please see Chap. 4.
6.3.7 Electroencephalogram
The electroencephalogram or EEG is a noninvasive method to record brain waves along the scalp. It uses the standard 10–20 electrode system for reproducibility over time and picks up the summation of electrical activity of millions of neurons generated primarily by pyramidal cells of the cortex. The standard EEG montage has 21 electrodes that are named according to their placement on the scalp, including a reference and a ground electrode, according to frontal, temporal, central, parietal, occipital, and auricular. The analog voltage potential that exists between electrodes is acquired as a digital waveform using the EEG acquisition system hardware and software. The different waveforms seen normally in an adult are grouped in five different categories based on their frequency domain characteristics: delta waves <4 Hz, theta waves 5–7 Hz, alpha waves 8–12 Hz, beta waves 13–31 Hz, and gamma waves >32 Hz. The frequency distribution varies with age, where in childhood we primarily see lower frequencies with higher frequencies occurring in adults.
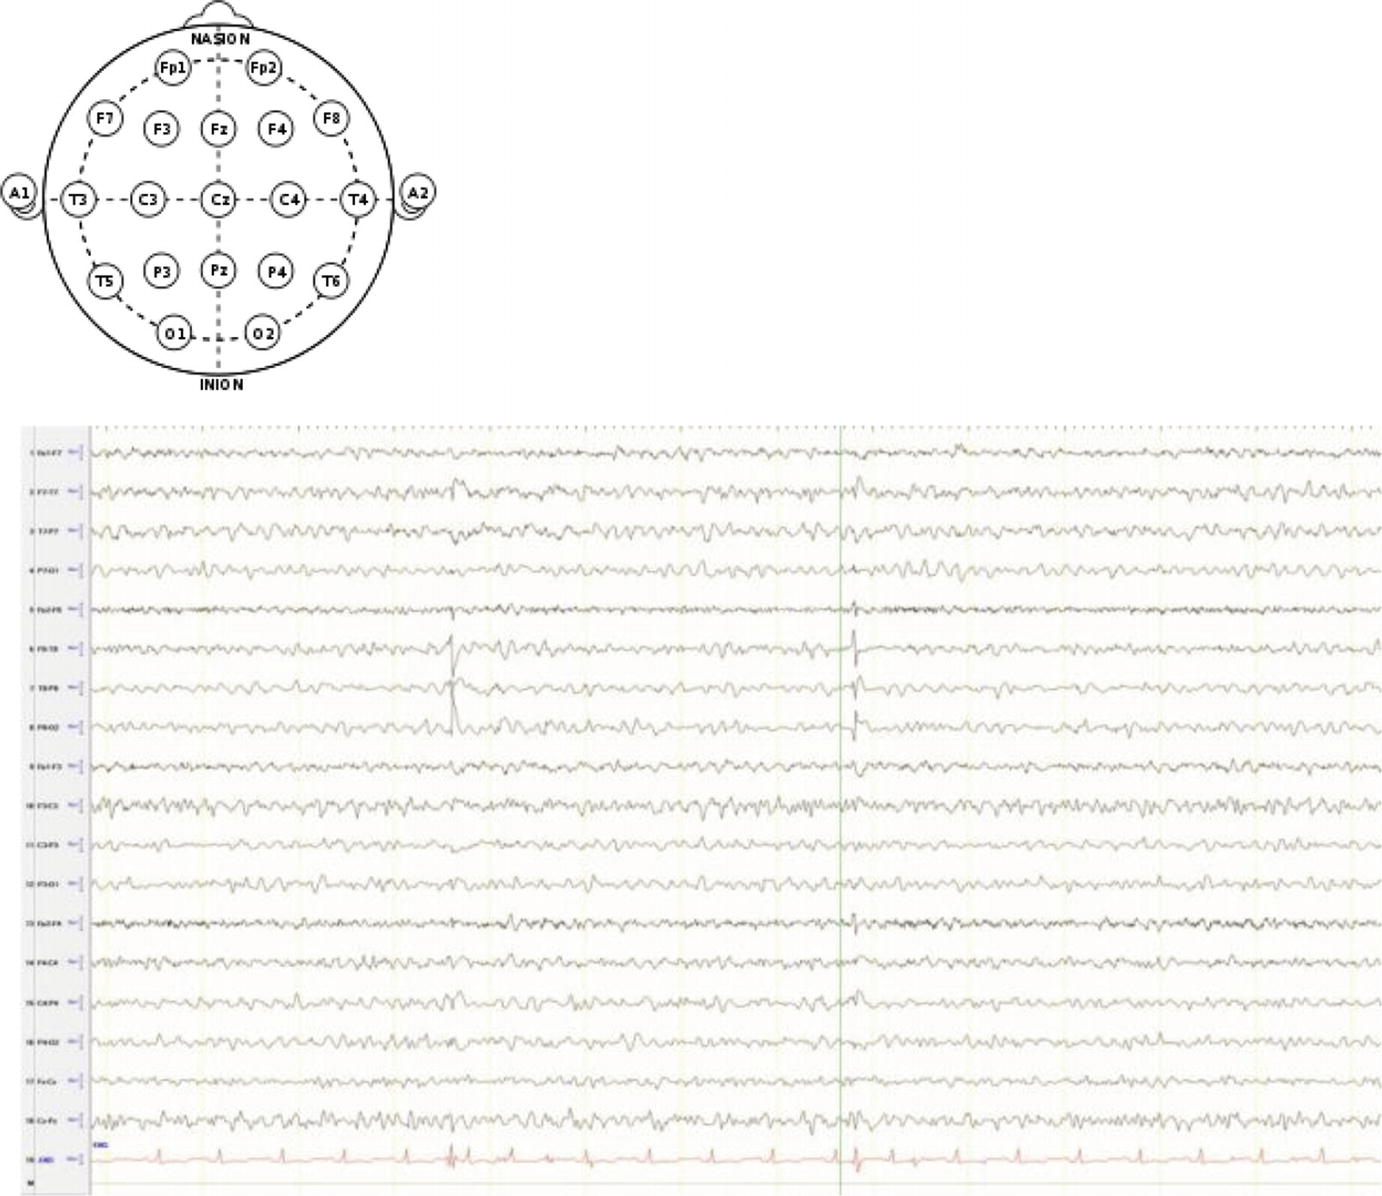
EEG montage and typical EEG waveforms
EEG is primarily used in the diagnosis and treatment of epilepsy and in sleep disorders, where the amplitude and frequency of waveforms provide valuable clinical information. In critical care, EEG is acquired in status epilepticus, coma, determination of brain death, hypothermia, depth of anesthesia in the OR, degree of brain perfusion in carotid endarterectomy, and localization of seizures for surgical therapy in refractory epilepsies. EEG waveforms recorded at the bedside often include an audio and/or a video feature with an alarm button that can be used by the patient if awake and aware, or the nurse at the onset of a seizure or spell that marks the time on the screen for view by an electroencephalographer. A seizure spike waveform has duration of 20–70 ms followed by a slow delta wave. For a detailed review of EEG in the ICU, please see Chap. 5.
6.4 Data Analysis in the ICU
6.4.1 Heart Rate Variability
Heart rate variability (HRV) includes both conventional and novel measures that are based on time domain and frequency domain analysis. Conventional time domain HRV measures have been defined for NN (normal to normal) intervals that correspond to intervals that are detected between adjacent QRS complexes of a continuous artifact-free ECG [15]. NN specifically refers to the intervals between normal heartbeats resulting from sinus node depolarizations that are included in the analysis. There are two main sources of ECG artifact, measurement and physiological, depending on the source. For example, movement and bad electrode connections are measurement artifacts, and arrhythmias (PVC or PAC) are physiological artifacts. Therefore, continuous artifact-free ECG segments are to be used in HRV analysis.
Conventional HRV uses statistical measures such as mean, standard deviation (SD), and root mean square (RMS) to quantify the variability. Statistical measures can depend on the length (window) of the data being analyzed, so it is common to use 5-min artifact-free ECG epochs for short-term variability analysis and 24-h recordings for longer-term studies. Comparisons of HRV statistical measures should be done only for data of similar length. Typical statistical HRV quantities include MNN (mean of the NN intervals), SDNN (the mean of the 5-min standard deviations of NN intervals calculated over 24h), SDANN (standard deviation of the average NN intervals calculated over 5-min periods), RMSSD (square root of the mean squared differences of successive NN intervals), NN50 (number of interval differences of successive NN intervals greater than 50 ms), and pNN50 (proportion derived by dividing NN50 by the total number of NN intervals).

Stay updated, free articles. Join our Telegram channel

Full access? Get Clinical Tree


