12 Electrodiagnostic examination
Nerve Conduction Studies
Nerve conduction in the upper limb
Motor nerve conduction
Stimulation
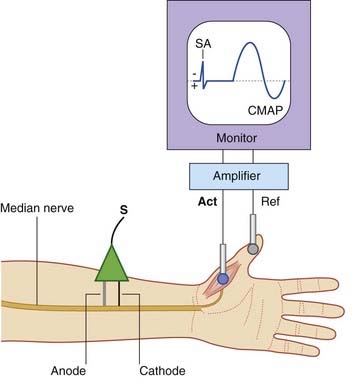
A typical stimulating electrode is one with an anode and a cathode in the form of two blunt prongs which are applied to the skin surface overlying the nerve. In Figure 12.1 it has been placed over the median nerve at the wrist (just lateral to the cordlike palmaris longus tendon). The cathode is placed nearer to the recording site than the anode in order to prevent any conduction block by the anode. When sufficient current is passed from cathode to anode, transmembrane ionic movements initiate impulse propagation in both directions along the nerve. Large myelinated nerve fibers lying nearest the cathode are the first to become depolarized; these include the Aα diameter axons of anterior horn motor neurons. A pulse of 20–40 mA with a duration of 0.1 ms is usually sufficient to activate all motor units in abductor pollicis brevis.
Recording
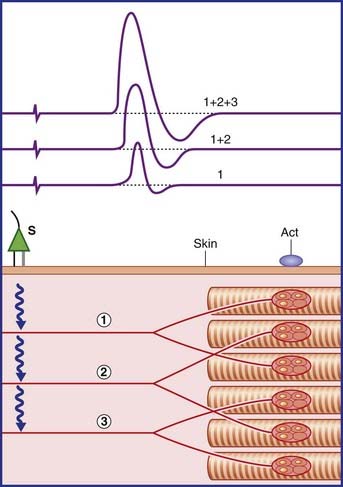
Increasing the applied voltage activates additional motor units until all are activated by each pulse. The required stimulus is called maximal. For good measure, the final stimulus is often supramaximal at 5–10% above maximal. The final waveform observed constitutes the compound motor action potential, or CMAP. It is produced by summation of the individual muscle fiber potentials (Figure 12.2).
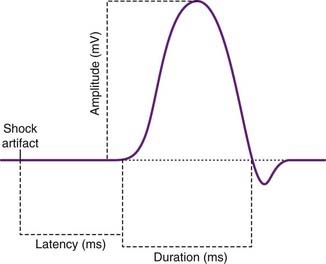
Routine measurements of the final CMAP are shown in Figure 12.3. They include the latency (time interval) between stimulus and depolarization onset, and the amplitude and duration of the negative phase of the waveform. (The final, positive phase is produced by inward ion movement during collective repolarization of the muscle fibers.)
Motor nerve conduction velocity (MNCV)
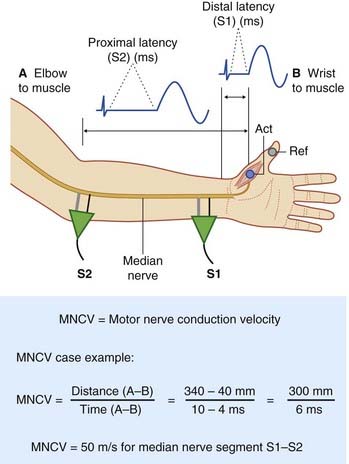
The setup required to determine motor nerve conduction velocity for the median nerve is straightforward, as shown in Figure 12.4. Here the nerve has first been activated at the wrist (S1) to generate and store a ‘wrist to muscle’ velocity record. The stimulator has then been placed over the median nerve at the elbow (S2) to provide an ‘elbow to muscle’ record. Speed being the product of distance over time, the elbow-to-wrist conduction velocity is given by subtracting one value from the other, as illustrated by the case example.
Sensory nerve conduction
For studies of sensory nerve conduction velocity (SNCV), the median is again the nerve of choice (Figure 12.5). Again it is large myelinated nerve fibers that will be stimulated, and the site and manner of stimulation at elbow and wrist will be the same. On this occasion, however, we are selectively recording antidromic stimulation of cutaneous sensory fibers – specifically, of the digital branches of the median nerve to the skin of the index finger, which is wearing an active recorder in the form of a ring.
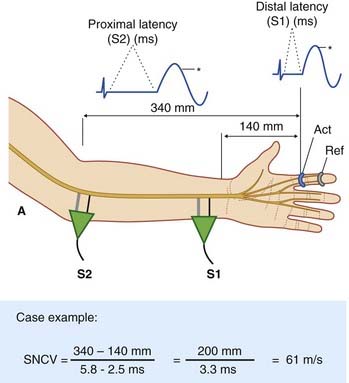
The prime function of the myelinated nerve fibers to be sampled by the ring recorder are those supplying the highly sensitive and discriminatory skin of the finger pad, described in Chapter 11. The largest, serving Meisssner and Pacinian corpuscles and Merkel cell–neurite complexes, are known to normally conduct at a speed of 60–100 m/s and the finest, serving mechanical nociceptors, at 10–30 m/s. This tenfold variation is in marked contrast to that of the relatively uniform fiber size of the stem axons supplying the small motor units of the abductor muscle and conducting at 45–55 m/s. One consequence is that, when stimulating sensory nerves at increasing distances from the recording site, a change in the waveform shape is normally noted. In the figure, the asterisks are intended to highlight the difference in the shape of the waveforms of the two compound sensory nerve action potentials (CSNAPs). Two factors are involved:
Sensory nerve conduction velocity (SNCV)
The basic modes of operation and calculation are the same as shown for the MNCV study. A case example is included in Figure 12.5 which demonstrates phase cancellation from temporal dispersion.
Nerve conduction in the lower limb
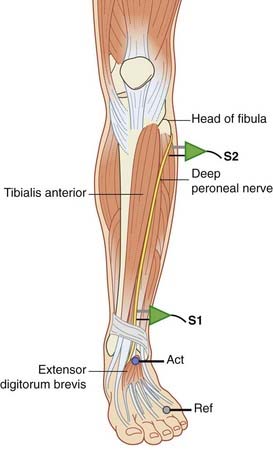
The lower limb muscle most frequently sampled for motor nerve conduction velocity is extensor digitorum brevis on the dorsum of the foot (Figure 12.6). The deep peroneal nerve is stimulated first in front of the ankle and then at the level of the neck of the fibula. At times, tibialis anterior is also sampled; in this case the nerve is stimulated first at the neck of the fibula and then at the lateral edge of the popliteal fossa next to the biceps femoris tendon.
A second choice for MNCV is the tibial nerve recording from adductor hallucis, located on the medial side of the foot (Figure 12.7A).
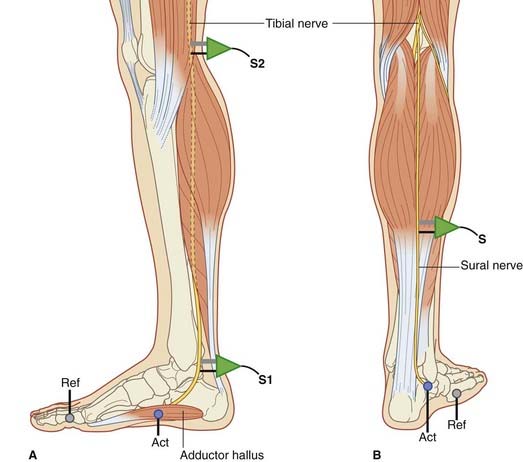
For SNCV assessment, the sural is the nerve of choice. The sural arises from the tibial and receives a contribution from the peroneal; it supplies the skin along the lateral margin of the foot. The recorder is applied to the skin below the lateral malleolus, and the nerve is stimulated antidromically at the levels shown in Figure 12.7B.
Nerve root pathology
Nerve root pathology is known as radiculopathy (L. radix, ‘root’). Radiculopathies are encountered:


