Electroencephalographic and Magnetoencephalographic Source Modeling
John S. Ebersole
Hermann Stefan
Christoph Baumgartner
Introduction
Many patients who suffer from medically uncontrolled partial seizures are candidates for epilepsy surgery. A significant rate-limiting factor in delivering this care is the evaluation necessary to determine whether the epileptogenic focus is localized to a resectable brain region. Significant additional delay, expense, and some morbidity are incurred if intracranial electroencephalographic (EEG) monitoring is necessary. Accordingly, there has been great emphasis recently on improving noninvasive presurgical localization of focal epileptic activity and functionally important cortical areas. Although various imaging techniques are now playing a significant role, we continue to rely on the analysis of interictal spikes and ictal patterns recorded by scalp EEG for functional localization. However, the information obtained in this regard from traditional visual inspection of the EEG has not changed much over the last 20 years. Localization is often limited to defining the electrode with greatest spike amplitude or clearest seizure pattern. These data have, at best, an imperfect relationship to the underlying cerebral source. Visual inspection of the EEG is, in fact, mainly used to lateralize the most epileptogenic area rather than to localize it. If our understanding of the clinical neurophysiology of epilepsy is to advance, we must go beyond simple description of EEG waveforms and pursue the physiology and location of the underlying generators. Visual inspection and qualitative impressions should be replaced by quantitative characterization. Among the noninvasive approaches, source localization techniques applied to epileptiform EEG potentials and magnetoencephalographic (MEG) fields appear to be particularly promising. This chapter reviews the principles behind and the clinical applications of EEG and MEG dipole and other source models.
Electroencephalographic Dipole Source Modeling
Principles of Voltage Topography
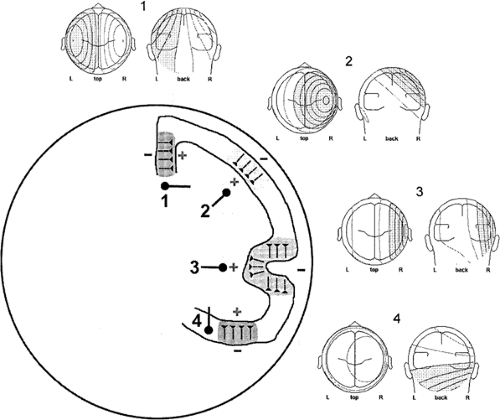
Neuronal excitation and inhibition are accompanied by current flow across the membrane of and through affected cells. From these, secondary currents and a voltage potential field are generated in the extracellular space. The orientation of an EEG voltage field is orthogonal to the surface of the generating cortex because it is aligned with the pyramidal cells that are thought to produce it. Most epileptiform transients are initially negative when recorded from electrodes on or above the cortical surface. Electrodes on the opposite side of the generating cortical layer, whether in underlying white matter or even on the scalp at the other side of the head, would record a positive potential. The scalp voltage fields that we measure, therefore, have dipolar configurations, that is to say, two maxima—one negative and one positive (Figs. 1 and 2). Thus, what a given electrode records is very dependent on the orientation as well as the location of the source relative to the sensor. In general, it is the complete contour of the spike voltage field over the head that provides information about the location and orientation of its cerebral generator.
Cerebral sources that generate epileptiform potentials that can be recorded at the scalp are quite large, usually consider-ably larger than the 6 cm2 often quoted in the literature.29 Recent measurements of simultaneous intracranial and scalp EEG have shown that cortical spike sources commonly encompass 10 to 30 cm2 (Figs. 3 and 4).34,36.161 Voltage fields from opposing walls of individual sulci tend to cancel each other, leaving the major lobar outline of gyral crowns to predominate in producing the net voltage field. Spike sources may recruit adjacent cortex into discharging. The net geometry of activated cortex becomes different at different times during the course of this propagating spike, which, in turn, produces a change in field maxima position or shape. Thus, temporal evolution of the scalp voltage field provides information about changes in source geometry due to sequential cortical activation or propagation (Figs. 2 and 4).
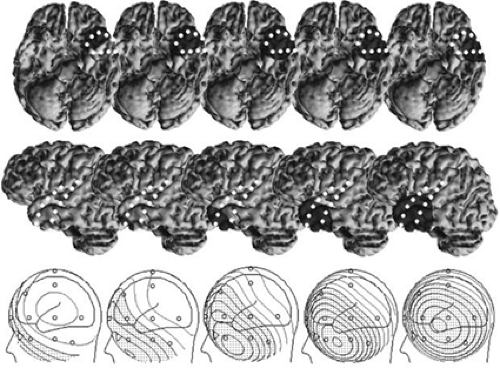 FIGURE 4. Subdural strip electrodes LAT (left anterior temporal) and LMT (left mid temporal) depicted on a three-dimensional reconstruction of the patient’s brain. Voltage topography of the same temporal spike as in FIGURE 3 at five time points is illustrated at the bottom. Location and area of the cortical spike source at each time point is shown as a shaded region. Sources were estimated from the subdural electrodes recording active spike depolarization at that time point. Note the progressive propagation of the source from the inferior temporal tip to the anterolateral temporal cortex and the associated movement of the negative spike field maximum. Note also the enlarging area of the cortical source. |
Principles of Electroencephalographic Dipole Modeling
Dipole localization techniques are based on electric field theory applied to volume conduction that was developed by Helmholtz66 in the mid-nineteenth century. Nearly 100 years later, electroencephalographers began to consider the physical relationship between electric fields on the scalp and their underlying sources within the brain.20,60,148,151 At the same time, Wilson and Bayley169 developed a method for calculating the voltage field generated on a spherical volume conductor by a known dipole. In simple terms, if the location, orientation, and strength of a dipolar source within a spherical and homogeneous conducting medium is known, one can predict the shape and magnitude of the potential field that is measurable on its surface. The answer to this type of problem has been called the “forward solution,” and it is unique. There is only one field that can be generated by a given dipole. However, the usual clinical problem is the opposite, namely, trying to locate the intracerebral generator, having measured the topography of a
scalp potential. The answer to this is called the “inverse solution,” and, unfortunately, for any given voltage field there is no unique answer. Rather, there are multiple possibilities because the fields of sources in a volume conductor sum linearly (the principle of superposition). Therefore, the field measured by a given electrode array may well be a composite from a number of different sources.
scalp potential. The answer to this is called the “inverse solution,” and, unfortunately, for any given voltage field there is no unique answer. Rather, there are multiple possibilities because the fields of sources in a volume conductor sum linearly (the principle of superposition). Therefore, the field measured by a given electrode array may well be a composite from a number of different sources.
Certain assumptions are necessary to apply these principles to human EEG. First, the brain is usually modeled as a sphere of uniform conducting material,25 and concentric shells are added around this to imitate the skull and scalp.32,33,75,128,146 The brain and scalp are usually considered to be of equal resistivity, and the intervening skull is considered to have a resistivity that is 80 times greater. In addition, for ease of modeling, the source of the field is considered to be a point-like dipole. Obviously, the generators of scalp spikes are not point sources, but rather large aggregates of neurons that extend over 10 to 30 cm2. However, the combined activity of such a generator region can be modeled effectively by a single dipole. That is, the field that would be produced by this “equivalent dipole” is very similar to that of the real source. As a first approximation, the equivalent dipole should reside close to the center of the real generator area and have a similar net orientation (Fig. 5).
Single Moving-dipole Model
The most common form of source localization is the instantaneous single-dipole inverse solution. This procedure takes the voltage values from all electrodes at a given instant in time and searches, using iterative minimization techniques, for an equivalent dipole within a spherical head that could generate such a field.32,33,67,75,141,146 This method defines a single equivalent source for a voltage field at one point in time. Regardless of the complexity of the real cerebral sources, the resultant compound activity is simplified into that of a single-dipole generator.
Spike voltage fields evolve over time, but the instantaneous single-dipole technique models the field at only one instant. Temporal evolution of a voltage field can be described, however, by a series of sequential single dipoles that can move in position and orientation over time, and these can be displayed in
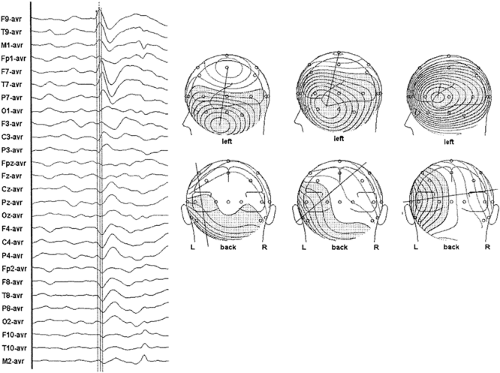
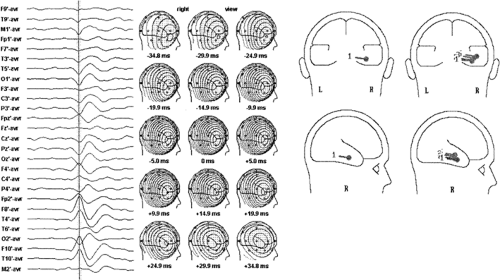
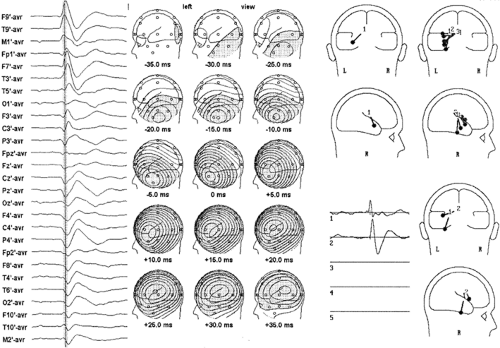
one image as a “moving” dipole.35,36 For some spikes, repeated dipole solutions are very consistent during the course of the potential, varying only in magnitude and little in position or orientation (Fig. 6). A single-dipole model fits these types of data well and suggests a discrete cerebral generator or nearly synchronous activation of several generator regions. For other spikes, sequential solutions over the potential’s time course show progressive drift in dipole location and rotation of vector orientation (Fig. 7). Such behavior of the dipole model is incompatible with a single generator region and suggests asynchronous activation of different cortical areas. The direction of dipole movement can convey useful information about likely spike propagation, as long as it is simple and unidirectional. Moving dipoles that spiral in a loop or make sudden turns in direction or position are usually the result of fields created by superposition of early source repolarization and later source depolarization or several different asynchronous sources. Therefore, one-dipole solutions can be misleading, particularly at later latencies when propagation is likely to have occurred, resulting in increased source complexity. Accordingly, several investigators recommend modeling the rising phase of the spike rather than the spike peak or later potentials.72,88,89,139 However, a different technique is required to model successfully several simultaneously active sources.
one image as a “moving” dipole.35,36 For some spikes, repeated dipole solutions are very consistent during the course of the potential, varying only in magnitude and little in position or orientation (Fig. 6). A single-dipole model fits these types of data well and suggests a discrete cerebral generator or nearly synchronous activation of several generator regions. For other spikes, sequential solutions over the potential’s time course show progressive drift in dipole location and rotation of vector orientation (Fig. 7). Such behavior of the dipole model is incompatible with a single generator region and suggests asynchronous activation of different cortical areas. The direction of dipole movement can convey useful information about likely spike propagation, as long as it is simple and unidirectional. Moving dipoles that spiral in a loop or make sudden turns in direction or position are usually the result of fields created by superposition of early source repolarization and later source depolarization or several different asynchronous sources. Therefore, one-dipole solutions can be misleading, particularly at later latencies when propagation is likely to have occurred, resulting in increased source complexity. Accordingly, several investigators recommend modeling the rising phase of the spike rather than the spike peak or later potentials.72,88,89,139 However, a different technique is required to model successfully several simultaneously active sources.
Interpretation of Single-dipole Models
Unfortunately, solutions for an equivalent-dipole source seldom reflect precisely the location of actual cerebral generators. Clinical interpretation requires an appreciation for
the weaknesses in the modeling assumptions and the complexity of source geometry and physiology. Equivalent dipoles are usually located deep to the true source cortex. Dipole localization techniques are least accurate in depth determinations because this estimation depends on the size of the generator region. Single-dipole solutions provide a reasonable approximation for superficial cortical sources if their diameter is smaller than 2 cm, such as with somatosensory-evoked potentials.50,132 Activation of a larger area of cortex, which is likely in the case of epileptiform spikes, produces a more diffuse scalp field that would be modeled as a deeper equivalent dipole. A large area of activated cortex also means that tangential fields from opposing sulcal walls will often cancel one another, allowing radial components to predominate. A reasonable simplification for interpreting spike dipole models is to consider only sources on the major outline of brain lobes. Accordingly, a tangentially oriented dipole is more likely to reflect an appropriately oriented major cortical surface or fissure, such as the temporal lobe base or sylvian fissure, rather than an individual sulcus. Dipole orientation is often more useful than is dipole location in determining which area of cortex in a given lobe is the likely generator.
the weaknesses in the modeling assumptions and the complexity of source geometry and physiology. Equivalent dipoles are usually located deep to the true source cortex. Dipole localization techniques are least accurate in depth determinations because this estimation depends on the size of the generator region. Single-dipole solutions provide a reasonable approximation for superficial cortical sources if their diameter is smaller than 2 cm, such as with somatosensory-evoked potentials.50,132 Activation of a larger area of cortex, which is likely in the case of epileptiform spikes, produces a more diffuse scalp field that would be modeled as a deeper equivalent dipole. A large area of activated cortex also means that tangential fields from opposing sulcal walls will often cancel one another, allowing radial components to predominate. A reasonable simplification for interpreting spike dipole models is to consider only sources on the major outline of brain lobes. Accordingly, a tangentially oriented dipole is more likely to reflect an appropriately oriented major cortical surface or fissure, such as the temporal lobe base or sylvian fissure, rather than an individual sulcus. Dipole orientation is often more useful than is dipole location in determining which area of cortex in a given lobe is the likely generator.
Patients with complex partial seizures of temporal lobe origin have been found to have spike voltage fields that could be
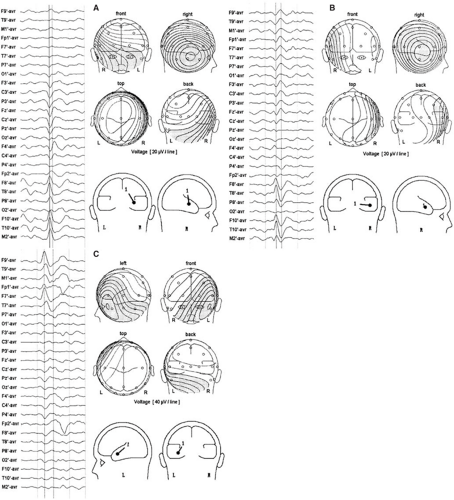
categorized into one of two patterns, termed type 1 and type 2.46,47 Type 2 spikes have a lateral temporal negative field maximum and a contralateral temporal positive field maximum. These spikes are well modeled by a single equivalent dipole located in the temporal lobe that has a radial and horizontal orientation (Figs. 6 and 8B).35,36 Type 1 spikes possess an inferior temporal negative field maximum and a vertex positive field maximum. They are modeled by a similarly located single equivalent dipole that has instead a vertical tangential to oblique orientation (Figs. 7 and 8A).35,36 In keeping with the foregoing interpretive guidelines, the horizontal, radial nature of type 2 spike dipoles suggests sources in lateral temporal cortex, whereas the more vertical and tangential orientation of type 1 spike dipoles suggests inferior and basal temporal cortex sources.
categorized into one of two patterns, termed type 1 and type 2.46,47 Type 2 spikes have a lateral temporal negative field maximum and a contralateral temporal positive field maximum. These spikes are well modeled by a single equivalent dipole located in the temporal lobe that has a radial and horizontal orientation (Figs. 6 and 8B).35,36 Type 1 spikes possess an inferior temporal negative field maximum and a vertex positive field maximum. They are modeled by a similarly located single equivalent dipole that has instead a vertical tangential to oblique orientation (Figs. 7 and 8A).35,36 In keeping with the foregoing interpretive guidelines, the horizontal, radial nature of type 2 spike dipoles suggests sources in lateral temporal cortex, whereas the more vertical and tangential orientation of type 1 spike dipoles suggests inferior and basal temporal cortex sources.
Spatiotemporal Multiple-dipole Model
It is overly simplistic to think that small brain regions are activated briefly in sequence when spikes propagate. It is more reasonable that adjacent cortical areas are activated for a longer period but not synchronously. Source modeling with single instantaneous dipoles cannot take into consideration such an overlap of activity of multiple generators, nor can it decompose the voltage fields produced by this superposition. Spatiotemporal source modeling is, however, an approach based on this rationale.133,138,139 Dipoles are fixed in location and orientation but can vary over time in strength and polarity to explain the temporal evolution of a voltage field. Sufficient degrees of freedom are obtained to calculate multiple dipoles from this positional constraint and from modeling over several time points. The solution for a given data set reveals not only a best-fit location for the model, but also the putative activity of each dipole over time in the form of a source potential (Fig. 7).
Because there is no unique solution when trying to identify several sources that may underlie a voltage field that is a composite, it is necessary to use modeling strategies to constrain the solutions to those that are most realistic. Two major categories of strategies include those based on sequential temporal activation of adjacent generator areas and those based on the orientation of the cortical areas likely to be involved
in the process. Implicit in the “temporal” strategy is the idea that the earliest part of a spike waveform is more likely to be the product of a single source than are later segments. Accordingly, one should first attempt to model the early part of the field evolution as a single dipole rather than the spike peak, for example. Additional dipoles are used in sequence to model the residual field left unexplained by the preceding dipole(s). If the initial equivalent source explains, in spatiotemporal terms, the entire spike field evolution, the generator is rather discrete or simple in character. Commonly, however, two or sometimes three dipoles are necessary to explain “focal” spike data. The spatiotemporal technique attempts to find the fewest number of fixed equivalent sources that can explain field evolution by a temporal overlap of activity among them.
in the process. Implicit in the “temporal” strategy is the idea that the earliest part of a spike waveform is more likely to be the product of a single source than are later segments. Accordingly, one should first attempt to model the early part of the field evolution as a single dipole rather than the spike peak, for example. Additional dipoles are used in sequence to model the residual field left unexplained by the preceding dipole(s). If the initial equivalent source explains, in spatiotemporal terms, the entire spike field evolution, the generator is rather discrete or simple in character. Commonly, however, two or sometimes three dipoles are necessary to explain “focal” spike data. The spatiotemporal technique attempts to find the fewest number of fixed equivalent sources that can explain field evolution by a temporal overlap of activity among them.
Several different patterns of multiple dipole models have emerged in applying this technique to the spikes of patients with presumed temporal lobe epilepsy.17,19,35,36,37 Spikes with a type 1 topography usually require two or more dipoles to be modeled adequately (Fig. 7). One of these dipoles typically has an orientation that is vertical and tangential to the lateral skull convexity, whereas the other is horizontal and radial. The tangential dipole is usually deeper than the radial one. Type 1 spike topography is the result of the superposition of fields from both sources when their activity overlaps in time. Source analysis of type 1 spikes from different patients has shown tangential source activity leading, lagging, or being synchronous with radial source activity. The pattern of voltage field evolution for a particular spike thus depends on the temporal relationships of its various source components. Information about the direction of spike propagation is conveyed by the sequence in which dipole sources become active. Simultaneous intracranial and scalp EEG recordings have validated previous assumptions that the vertical tangential dipole models activity from basal temporal lobe cortex and the horizontal radial dipole models activity from lateral temporal cortex.42,137 Spikes confined to the hippocampus produced no scalp-recognizable voltage field. However, when these spikes propagated to basal cortex, which was common, sufficient cortex was activated to result in a scalp potential. Basal to lateral cortex propagation and vice versa, suggested by timing differences in dipole source components, have also been confirmed.
The majority of spikes with type 2 topography require only one horizontal radial dipole to be modeled (Fig. 6); in approximately one third of patients, however, two or more dipoles are needed. In these cases, the dipoles usually differ in azimuth orientation and anteroposterior position yet continue to be predominantly radial. Differences in timing between these sources can suggest anterior to posterior or, less commonly, posterior to anterior propagation along the lateral temporal convexity.
More recently, dipole modeling has identified a third major cortical source contributing to typical temporal spike fields.40,41,137 Synchronous activity of anterior temporal tip cortex results in a field with a negative maximum recorded from frontopolar and frontotemporal electrodes because of its net forward-facing orientation. Dipoles modeling this activity are horizontal but have a distinct anterior-posterior (AP) vector (Fig. 8C). Occasionally, spikes have just this dipole solution, but usually the tip component is present in combination with other temporal source components in more complex spikes that exhibit propagation.
Modeling strategies using anatomic constraints can also be useful. Unconstrained inverse-solution mathematics considers any position within the spherical head model and any orientation of dipole vector to be equally likely as a source. This is obviously not true biologically. Spikes arise from cortex that has limited and definable locations and orientations. Of the two, it is more useful to specify the orientation of possible
equivalent sources. As noted previously, it is reasonable to consider for purposes of modeling only the orientations of major lobar surfaces. For the temporal lobes, these orientations are horizontal radial for the lateral convexity cortex, vertical tangential for the basal cortex and superior temporal plane, and AP horizontal tangential for the temporal tip (Fig. 4). One approach in using this strategy for the temporal lobes is to create a priori a multiple spatiotemporal dipole model of major lobar surfaces based on specific orientations obtained from brain imaging studies and to note from the source potentials the extent to which each dipole can contribute to explaining spike voltage fields over time.2,3,136,137
equivalent sources. As noted previously, it is reasonable to consider for purposes of modeling only the orientations of major lobar surfaces. For the temporal lobes, these orientations are horizontal radial for the lateral convexity cortex, vertical tangential for the basal cortex and superior temporal plane, and AP horizontal tangential for the temporal tip (Fig. 4). One approach in using this strategy for the temporal lobes is to create a priori a multiple spatiotemporal dipole model of major lobar surfaces based on specific orientations obtained from brain imaging studies and to note from the source potentials the extent to which each dipole can contribute to explaining spike voltage fields over time.2,3,136,137
Dipole Modeling in Clinical Investigations
By the mid 1990s several investigators began to apply EEG dipole modeling to the evaluation of epilepsy surgical candidates. In general they confirmed findings from earlier studies. In a series of investigations, Boon et al.19,20,21,22,23 demonstrated that patients with medial temporal lesions had EEG spikes and early seizure rhythms that were modeled by dipoles having an elevated orientation above the horizontal (a combination of radial and tangential) similar to Ebersole’s type 1 spike, whereas patients with lateral temporal or extratemporal lesions had EEG spike and early seizure rhythms that were modeled by dipoles having a radial orientation similar to Ebersole’s type 2 spike. In a series of studies using simultaneous scalp and intracranial EEG recordings, Lantz et al. confirmed that dipole orientation was the major distinguishing factor in distinguishing spikes originating from basomesial temporal sources from those of lateral temporal origin.86,90,92 Merlet and Gotman99,100 in a pair of papers validated dipole models of spikes or seizures with a later combination of intracranial and scalp EEG. They concluded that only simple cortical sources could be well modeled by one dipole and that spike modeling yielded better and more frequent results than seizure modeling. Numerous other publications began appearing in the late 1990s that confirmed a good correlation between spike dipole models and other localization tools such as intracranial EEG,69,106 positron emission tomography,145 single photon emission tomography,124,145 and magnetic resonance imaging (MRI) lesions in both adults and pediatric patients.83
Dipole Modeling of Seizures
Dipole modeling can also be applied to seizure rhythms with some modifications in the protocol used for spikes.19,20,21,22,23,37,38,40,41,100 The earliest recognizable seizure potentials should be preferentially modeled because they are more likely to reflect the seizure origin than are later rhythms, which usually evolve only after significant propagation. In most instances, the EEG must be filtered with a narrow band pass covering those frequencies that represent the cerebral seizure activity and not the accompanying artifact. For partial seizures of the temporal lobes, this is approximately 2 to 10 Hz. For extratemporal seizures that commonly have a beta frequency component, this is a broader 2 to 20 Hz.
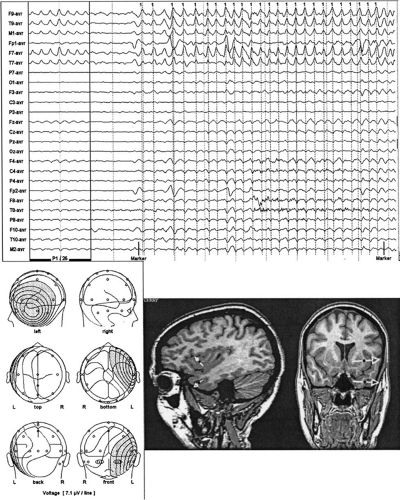
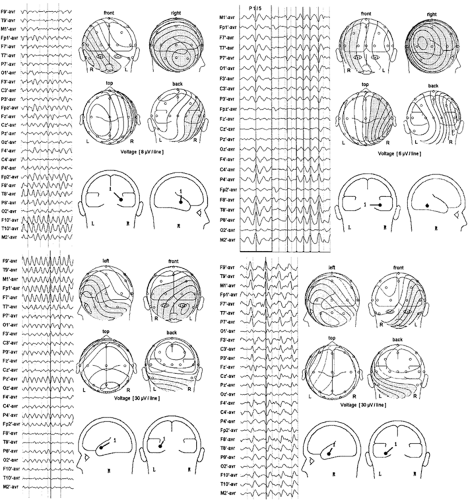
Because ictal onset rhythms are typically of low amplitude and are commonly confounded with movement and muscle artifacts, averaging successive potentials might be necessary to increase the signal-to-noise ratio. The key is to average seizure waveforms with similar voltage topographies (Fig. 9); only these reflect the same source configuration. These periods of stable fields might last only a few seconds. Alternatively, spatiotemporal modeling can be performed over this stable epoch. One or more fixed dipoles possessing cyclic variations in the magnitude and polarity of their source potentials can often explain the repeating evolution of an ictal voltage field. Temporal and orientation strategies are applicable in seizure modeling, just as in spike modeling. Modeling sequential epochs during the course of the seizure can provide insight about seizure propagation.
The orientation of dipole models of ictal waveforms carries the same significance as those of spikes, and it is most useful in identifying sublobar temporal lobe sources.2,19,20,21,22,23,37,38,40,41 Temporal lobe seizures modeled by dipoles with dominant horizontal radial, vertical tangential, or horizontal tangential AP orientations are most likely associated with lateral temporal, hippocampal/basal, or temporal tip seizures, respectively (Fig. 10). In addition, many temporal lobe seizures are modeled best by dipoles having an anterior oblique orientation, that is, a combination of all three of the previous orientations (Fig. 10). In this case the ictally active cortical region includes inferior, tip, and lateral temporal cortex. Multiple fixed-dipole models can also be used to identify the contribution of various sublobar cortical areas to seizure potentials. This technique has recently been used to determine temporal lobe seizure origins and to predict surgical outcome following standard temporal lobectomy.2,3
Ictal EEG dipole models have been correlated with intracranial EEG and surgical outcome.2,1923,37,38,40,41 The results are similar to those found with spike dipole modeling. Patients with seizures modeled by horizontal radial dipoles, which suggest a lateral cortex origin, do less well following a standard anteromesial resection and should be considered candidates for invasive monitoring and possibly tailored temporal lobe resections. Patients whose seizures are modeled best by dipoles with a vertical, horizontal AP, or anterior oblique orientation have seizures originating probably in baso-mesial, temporal tip, and anterior inferior temporal cortex, respectively. All of these patients do well following surgery because these cortices are customarily removed in the standard temporal lobe resection.
Improvements in Recording and Modeling Techniques
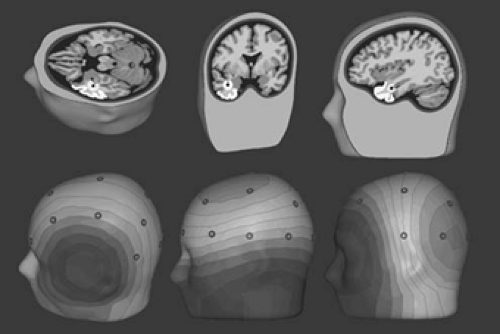
With the advent of volumetric computed tomography (CT) and MRI, detailed anatomic information about an individual’s head and brain has become readily available. However, only recently have these data been combined with EEG to provide “functional imaging” of the brain’s electrical activity. Three-dimensional reconstructions of MRI have demonstrated the geometric relationship between standard scalp electrode positions and the underlying brain.38,85 The standard International 10–20 temporal electrode chain passes across the superior aspect of the temporal lobe. Supplementary inferior temporal electrodes are necessary for properly recording the negative field of spikes and seizures from the basal cortex of frontal, temporal, and occipital lobes. Sphenoidal or the so-called anterior temporal electrodes, T1 and T2, are useful in this regard, but a broader spatial sampling of lower-head voltage fields is better for modeling purposes than simply one or two positions. Digitizing the scalp electrode locations and certain head fiducials, such as the nasion and preauricular points, in 3-space makes it possible for the topography of the scalp EEG fields to be coregistered with and superimposed on a three-dimensional (3D) MRI reconstruction of the patient’s head or brain. In similar fashion, calculated dipole models can be coregistered with the same 3D brain image (Fig. 11).38
Some have proposed on theoretical grounds that high-resolution EEG requires hundreds of electrodes,63 whereas others have concluded that the gain beyond 40 to 64 electrodes is negligible.84,176 This is particularly true for epileptogenic spike and seizure sources that tend to be large spatially and produce
voltage fields of low spatial frequency. Lantz et al.87 recorded spikes from patients with epileptogenic lesions with 128 electrodes and performed source modeling with various downsampled arrays. An increase in electrode number from 31 to 63 resulted in significantly improved localization, whereas only minimal additional precision was achieved with an increase in electrode number to 128.
voltage fields of low spatial frequency. Lantz et al.87 recorded spikes from patients with epileptogenic lesions with 128 electrodes and performed source modeling with various downsampled arrays. An increase in electrode number from 31 to 63 resulted in significantly improved localization, whereas only minimal additional precision was achieved with an increase in electrode number to 128.
Stay updated, free articles. Join our Telegram channel

Full access? Get Clinical Tree


