Fig. 30.1
nBCA. The patient has a history of hereditary hemorrhagic telangiectasia with a right cerebral hemisphere arteriovenous malformation. Axial non-contrast CT images shows the hyperattenuating embolic agent within the vascular malformation and associated aneurysm (arrow)
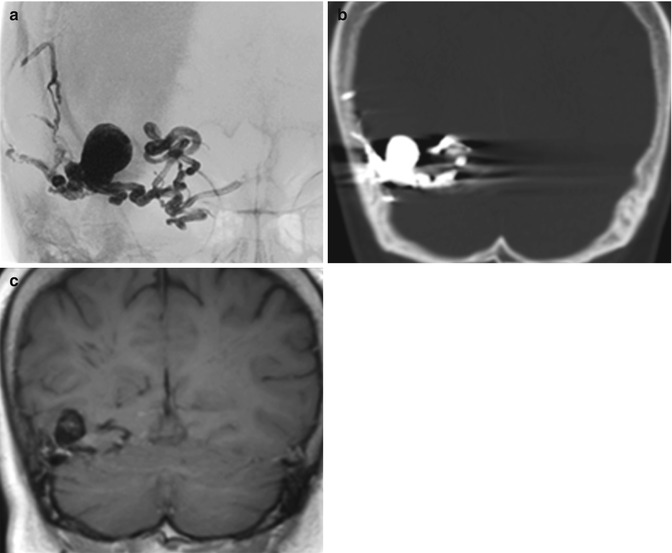
Fig. 30.2
Onyx. Frontal radiograph (a), coronal non-contrast CT (b), and coronal non-contrast T1-weighted MRI (c) show that the Onyx cast appears radiopaque and hyperattenuating and has molded to the shape of the arteriovenous malformation. There is associated beam-hardening artifact on CT
Gelfoam and PVA particles are commonly used for preoperative embolization of tumor vasculature, in order to minimize blood loss during surgical excision. In general, the advantage of using PVA is the greater tumoral devascularization from penetration of small tumor vessels. However, the use of PVA particles <150 μm raises the risk of embolization into the vasa nervosum of the cranial nerves, and higher rates of complications have been reported during preoperative embolization. In certain situations, particularly for embolization of tumors at the skull base, larger PVA particle size and Gelfoam are preferable. At the time of embolization, Gelfoam is often mixed with contrast agents in order to increase conspicuity on X-ray modalities. Otherwise, Gelfoam used for hemostasis in surgical cavity often initially appears as hypoattenuating sheets on CT but then becomes more hyperattenuating, and eventually dissolve (Fig. 30.3). On MRI, Gelfoam can appear as T1 hyperintense, which should not be mistaken for enhancement. Polyvinyl alcohol (PVA) particles are also mixed with contrast agents the time of embolization in order to facilitate visibility during angiography (Fig. 30.4). Although the particles cannot be directly visualized on imaging, the secondary effects of vascular occlusion and tissue necrosis may be evident (Fig. 30.5). With regard to meningiomas, postembolization MRI shows a variable degree of secondary revascularization and devascularization shortly after embolization. Peripheral secondary enhancement corresponds to a thin layer of viable tumor tissue, while the devitalized, necrotic portions do not enhance. MR spectroscopy may demonstrate a lactate peak in devascularized areas immediately after embolization. The tumors may or may not decrease in size following embolization.
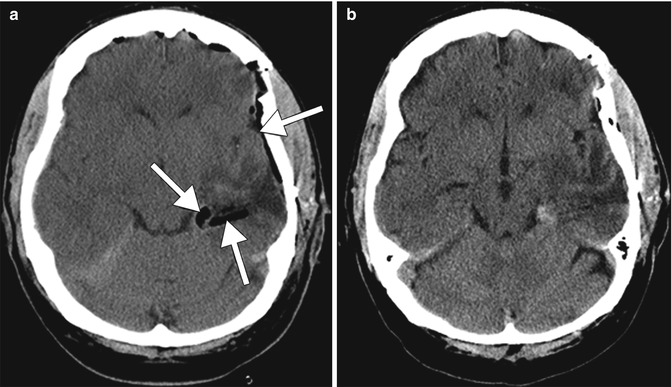
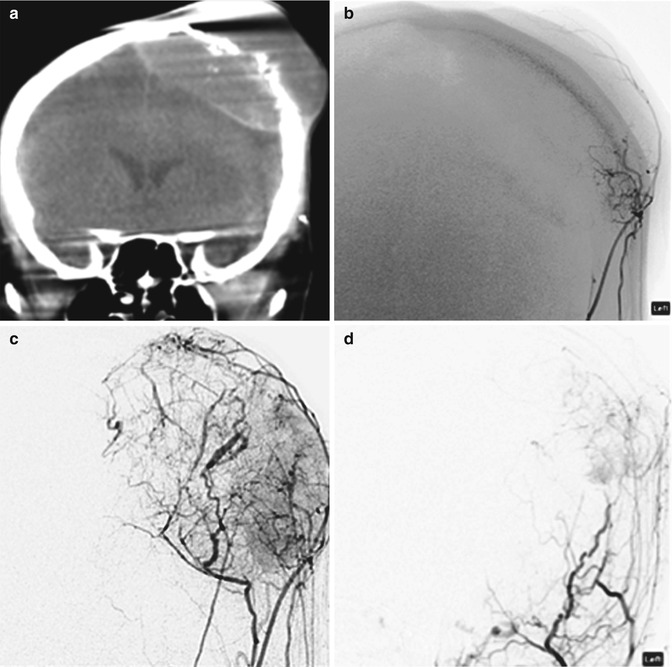
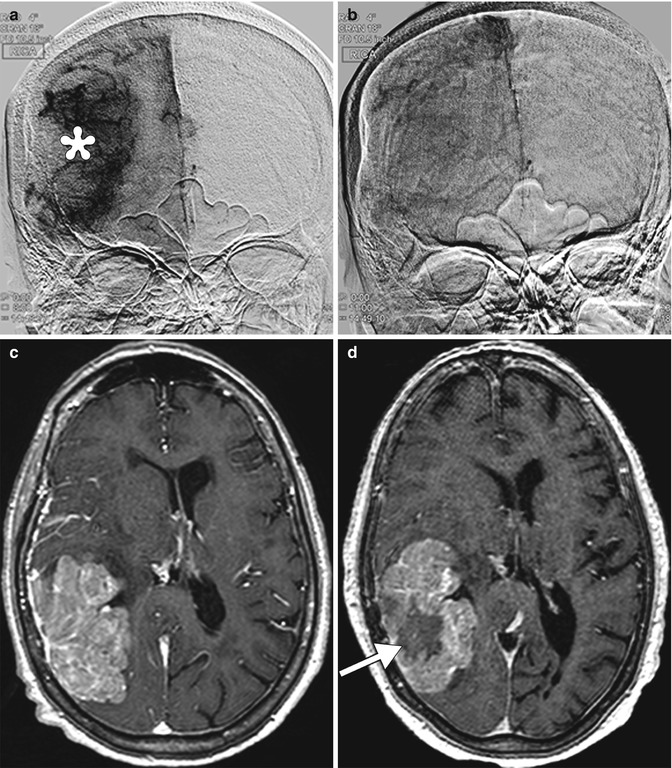
Fig. 30.3
Gelfoam. Initial postoperative CT image (a) obtained after left temporal lobe tumor resection shows linear hypoattenuation material lining the surgical bed, which corresponds to Gelfoam (arrows). Follow-up CT image (b) obtained several days later shows interval resorption of the Gelfoam
Fig. 30.4
PVA. Coronal intra-procedural CT (a), early arterial (b), and parenchymal phase (c) external carotid DSA shows prominent tumor vascularity in a cranial plasmacytoma. Post PVA embolization external carotid DSA (d) shows multiple feeding branch occlusions and absence of the tumor blush
Fig. 30.5


Tumor necrosis. Initial frontal digital subtraction image (a) shows a large tumor blush, which corresponds to a meningioma. Completion digital subtraction image (b) obtained after Onyx embolization of the tumor shows marked diminution of the tumor blush. Pre-embolization axial post-contrast T1-weighted MRI (c) shows a large enhancing mass in the right temporo-occipital convexity. Post-embolization axial post-contrast T1-weighted MRI (d) shows interval development of central necrosis within the tumor (arrow)
Related posts:


Stay updated, free articles. Join our Telegram channel
Full access? Get Clinical Tree
