Prevalence (per 100,000 inhabitants)
Geographical region
Reference source
1.94
Japan
Sakushima et al. (2012)
7
USA
Kurtzke (1996)
8.2
New Zealand
Brickell et al. (2006)
12.6
Tatarstan, Russia
Authors’ data (2011)
The recorded incidence and prevalence of syringomyelia have not been constant through time. Between 1949 and 1978, for example, in southwest Germany, recorded cases fell from 25 to less than 1 case per year, per 100,000 inhabitants (Hertel and Ricker 1978; Schergna and Armani 1985). It was suggested that the enormous change in living habits over this period might have accounted for the decrease. In contrast, an epidemiological study in New Zealand found that the incidence of syringomyelia increased between 1961 and 2001, from 0.76 to 4.70 cases per year, per 100,000 population (Brickell et al. 2006). This increasing incidence might have been due to the changing ethnic composition of the population. There are clear ethnic differences in the prevalence of syringomyelia and its associated conditions (Table 2.2), although the extent to which these variations are due to environmental influences, as opposed to genetic factors, remains unknown. Pacific people and Maori have a higher prevalence of syringomyelia than other ethnic groups, and the percentage of Maori and Pacific people in the New Zealand population increased over the study period in the Brickell et al. survey. The population of Pacific people in particular grew 11 times faster than did other ethnic groups. A second possible reason for the increase in recorded incidence in New Zealand is, of course, simply the increased detection of syringomyelia, brought about by improved access to MR imaging.
Table 2.2
Ethnic differences in syringomyelia and related disorders
Disorders | Geographical region | Ethnic group | Prevalence (per 100,000 inhabitants) | Reference source |
|---|---|---|---|---|
Syringomyelia | New Zealand | Pacific people | 18.4 | Brickell et al. (2006) |
Maori | 15.4 | |||
Caucasians and other | 5.4 | |||
Syringomyelia associated with CM1 | New Zealand | Pacific people | 16.1 | Brickell et al. (2006) |
Maori | 8.3 | |||
Caucasians and other | 3.2 | |||
Syringomyelia | Russia, Bashkortostan | Tartars | 130 | Borisova et al. (1989) |
Russians | 0.5–12 | |||
Bashkirs | 0.32–0.6 | |||
Syringomyelia associated with CM1 | Russia, Tatarstan | Tartars | 14.8 | Authors’ data (2011) |
Russians (mainly) | 9 | |||
Chiari malformations with and without of syringomyelia | Russia, Tatarstan | Tartars | 33.4 | Authors’ data (2011) |
Russians (mainly) | 23.8 | |||
Syringomyelia associated with scoliosis | New Zealand | Maori and Pacific people | Children with scoliosis more likely than Caucasians to have syringomyelia | Ratahi et al. (2002) |
Syringomyelia | USA | African-Americans and Caucasians | Syringomyelia more prevalent in African-Americans | Tipton and Haerer (1970) |
The Tartar population in the Volga-Ural region of Russia, including Bashkortostan, Tatarstan and other areas, suffers from a particularly high prevalence of syringomyelia, at 130 per 100,000 inhabitants. In contrast, the prevalence among other ethnic groups, mainly Bashkirs and Russians, in the same geographic region, was no more than 12 per 100,000 population (Borisova et al. 1989; Borisova and Mirsaev 2007). Our own data, collected since 1998, revealed a less pronounced difference in the prevalence of syringomyelia between the Tartars and other groups, at 15 and 9 per 100,000 inhabitants, respectively. In addition, the prevalence among both Tartars and other ethnic groups varied significantly across different regions of Tatarstan, ranging between 3.7 and 93 per 100,000 adults in Tartars and between 2 and 92 per 100,000 in a population composed mainly of Russians.
Elsewhere in the world, the distribution of syringomyelia and related conditions, by country, region and even small territories, is extremely non-uniform (Table 2.3, Fig. 2.1). Such differences have been linked to environmental factors, for example, the size of a community, the distance between a patient’s place of residence and a diagnostic centre, the degree of physical exertion exercised by the individual as part of his or her profession, the number of siblings in the patient’ family, the order of his or her birth and the infant mortality rate in the patient’s family (Borisova et al. 1989; Hertel and Ricker 1978; Sirotkin 1972). Most of the patients with syringomyelia tend to come from large families and originate from the second half of the birth order. Infant mortality is especially high among the brothers and sisters of syringomyelia patients. Patients are more likely to live in small towns and are more likely to be employed in occupations involving hard physical labour. The high prevalence of syringomyelia in the north of Tatarstan may be associated not just with the predominance of the Tartar population in this region but also the employment of these people, mainly in physically demanding jobs in agriculture (author’s own data). Interestingly, however, syringomyelia prevalence may also vary with the soil type (Sirotkin 1972).
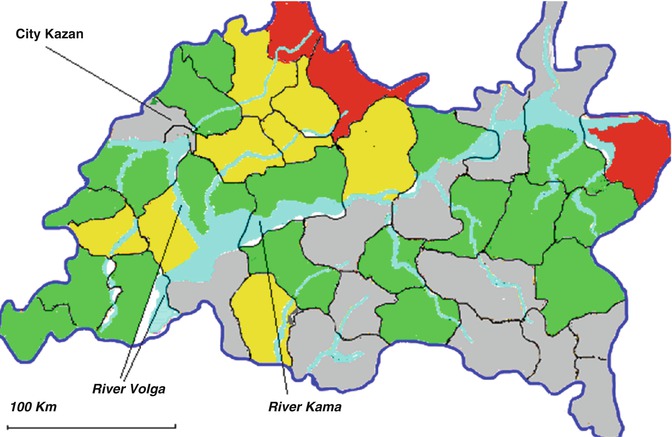
Table 2.3
Geographical distribution of syringomyelia and related disorders
Disorders | Countries and regions with high prevalence (per 100,000 inhabitants) | Countries and regions with low prevalence (per 100,000 inhabitants) | Reference sources |
|---|---|---|---|
Syringomyelia | Germany | Germany | |
Southwest | Northeast | Hertel and Ricker (1978) | |
Italy | |||
Piedmont, Valle d’Aosta, Toscana and Marche | Ciaramitaro et al. (2011) | ||
Russia | Russia | ||
Central regions in the valleys of the rivers Volga, Kama, Vyatka, Belaya | South regions | Borisova et al. (1989) | |
Russia | Russia | ||
Bashkortostan East and Northwest (80–130) | Bashkortostan Southwest (0.3–0.6) | Sirotkin (1972) Borisova et al. (1989) Borisova and Mirsaev (2007) Authors’ data. (2011) | |
Tatarstan North (63–83) | Tatarstan Southeast (4.3–5.5) | ||
Samara region Northeast (43–62) | Samara region South (6–20) | ||
Chiari malformations with and without of syringomyelia | Russia | Russia | |
Tatarstan North (100–148) | Tatarstan Southeast (9–14) | Authors’ data (2011) | |
Craniovertebral anomalies | India | ||
Uttar Pradesh, Bihar, Rajasthan, part of Gujarat | Goel (2009) | ||
Basilar impression associated with Chiari malformation | Brazil | ||
Northeast | Da Silva et al. (2011) | ||
Sagittal synostosis associated with Chiari malformation | Finland | Leikola et al. (2010) |
Fig. 2.1
Map of Tatarstan (Russia) with the prevalence of syringomyelia (per 100,000 adult inhabitants). Red = very high prevalence (>50); yellow = high prevalence (30–50); green = moderate prevalence (10–30); blue = low prevalence (<10). Regions with very high prevalence of syringomyelia are situated in a compact area in northern Tatarstan (Unpublished authors’ data 2011)
2.3 Causes of Syringomyelia
A study analysing autopsy results over a 38-year period identified 175 patients with tubular cavitations of the spinal cord. Just over a half of these cases were male and the mean age was just over 40 but with a range from 1 day to 87 years old. Non-neoplastic syringomyelia was found in 60 %, neoplastic cysts in 10 % and syringomyelia ex vacuo (i.e. atrophic syringes occurring with myelomalacia) in 30 % (Milhorat 2000). The reported frequency of the main causes of syringomyelia does, however, vary between clinical and MRI studies (Table 2.4).
Table 2.4
Syringomyelia by cause
Underlying cause | Proportion of all causes of syringomyelia (%) | Geographical region | Reference source |
|---|---|---|---|
Chiari malformation type 1 | 26 | Germany | Roser et al. (2010) |
32 | UK | Williams (1995) | |
48 | Japan | Sakushima et al. (2012) | |
48 | Italy | Ciaramitaro et al. (2011) | |
50 | New Zealand | Brickell et al. (2006) | |
77 | USA | Speer et al. (2003) | |
Chiari malformation type 2 | 4.6 | Italy | Ciaramitaro et al. (2011) |
8 | Japan | Sakushima et al. (2012) | |
2–14 | USA | Speer et al. (2003) | |
Trauma | 4 | USA | Speer et al. (2003) |
8 | Japan | Sakushima et al. (2012) | |
10 | New Zealand | Brickell et al. (2006) | |
19 | Germany | Roser et al. (2010) | |
24 | UK | Williams (1995) | |
Tumours | 0.4 | USA | Speer et al. (2003) |
3 | UK | Williams (1995) | |
5.2 | Japan | Sakushima et al. (2012) | |
12 | Germany | Roser et al. (2010) | |
32 | Croatia | Orsolic et al. (1998) | |
Inflammations of the spinal cord and meninges | 2 | Germany | Roser et al. (2010) |
4 | USA | Speer et al. (2003) | |
4.4 | New Zealand | Brickell et al. (2006) | |
5 | Japan | Sakushima et al. (2012) | |
Idiopathic | 13–25 | Japan | Sakushima et al. (2012) |
16 | New Zealand | Brickell et al. (2006) | |
28 | Germany | Roser et al. (2010) |
The cause of syringomyelia varies between different age groups, with Chiari malformation type 2 being the most common cause in younger patients, whereas in adolescents and adults, Chiari malformation type 1 predominates. In older age groups the cause of the syringomyelia may not always be apparent, and cases are more likely to be given the label of idiopathic (Sakushima et al. 2012).
2.3.1 Chiari Malformations
Most cases of syringomyelia are associated with Chiari malformation type 1, which in turn comprises the commonest abnormality encountered at the craniovertebral junction. It is characterized by underdevelopment of the posterior cranial fossa with overcrowding of an otherwise normally developed hindbrain (Milhorat et al. 1999; Nishikawa et al. 1997). A ubiquitous feature is compression of the retrocerebellar CSF spaces, and about nine out of ten cases have a tonsillar herniation that is at least 5 mm below the level of foramen magnum. Very commonly there are also radiographic signs of cranial base dysplasia , of varying degree (Milhorat et al. 1999). Chiari malformation type 1 has a reported male to female ratio of between 1:0.7 and 1:3.7 (Da Silva et al. 2011; Meadows et al. 2000; Milhorat et al. 1999; Takeuchi et al. 2007). The reported rate of Chiari malformation type 1 as an incidental finding on MRI of the brain ranges from 0.04 to 0.9 % (Meadows et al. 2000; Morris et al. 2009; Vernooij et al. 2007). The reported incidence is higher from studies using high-resolution MRI sequences. One study reported cerebellar tonsillar herniation in as many as 14.4 % of patients presenting with neck pain and/or upper limb symptoms (Takeuchi et al. 2007).
The reported occurrence of syringomyelia in association with Chiari malformation type 1 ranges from 65 to 80 % (Speer et al. 2003). Chiari type 1-related syringomyelia has also been reported as an incidental finding on MRI (Meadows et al. 2000; Nishizawa et al. 2001).
Chiari malformation type 2 is found only in patients with myelomeningocele. It is the leading cause of death in affected individuals under the age of 2, and up to 15 % of patients with early clinical manifestation of Chiari malformation type 2 die by the age of 3 years and nearly a third of survivors have some form of permanent neurological disability (Stevenson 2004). Outcomes in older children, presenting with myelopathy and/or pain, are much better, ranging from 79 to 100 % improvement in symptoms following surgery. The prevalence of Chiari malformation type 2 in the general population is 1 in 3,600.
Chiari malformation type 2 is associated with syringomyelia in 35 % of cases (Speer et al. 2003), and it accounts for up to 8 % of the total cases of syringomyelia, with a higher percentage in paediatric practice.
Borderline tonsillar herniation , 2–4 mm below the foramen magnum, has an estimated prevalence of 2.6 per 100,000 population, from all MRI scans of the brain (Takeuchi et al. 2007). Syringomyelia was found in just over half of these patients (Milhorat et al. 1999).
The definition of Chiari malformation type 1 is evolving from that of a simple anatomical description to the concept of it representing the clinical expression of a number of different pathologies. Five broad mechanisms causing cerebellar tonsillar have been described (Table 2.5) (Milhorat et al. 2010; De Souza et al. 2011). These include those which affect the development of the craniocervical structures. For example, the development of Chiari malformation type 1 was seen in 29 % of patients suffering from rickets and in 73 % of all cases of Crouzon ’s disease. A tight filum terminale has an associated Chiari malformation type 1 in 10 % of cases. Twenty-four percent of pseudotumour cerebri patients had inferiorly displaced cerebellar tonsils. In addition, venous sinus occlusion can be the cause of reversible hindbrain herniation (Novegno et al. 2008). The frequency of these different causes of cerebellar herniation is very variable (Table 2.6) and also has ethno-geographical differences (Da Silva et al. 2011; Milhorat et al. 1999, 2009, 2010; Novegno et al. 2008; Strahle et al. 2011a). Our own observation of 900 adult patients with Chiari malformations, over a 10-year period, found basilar impression in 17 % and non-syndromic craniosynostosis in 7.4 %. The incidence of hydrocephalus, when defined as an Evans’ index greater than 0.30, was present in as many as 54 % of patients. In contrast, the prevalence of basilar impression associated with Chiari malformation in the northeast of Brazil was more than 60 % (Da Silva et al. 2011). It may well be that differences in the frequency of cranial constriction, cranial settling and mild deformations of cranial shape can explain ethno-geographical differences in syringomyelia prevalence.
Table 2.5
Pathologies leading to Chiari type 1 hindbrain hernias
Cranial constriction |
Spinal cord tethering |
Cranial settling |
Intracranial hypertension |
Intraspinal hypotension |
Table 2.6
Causes of hindbrain hernias
Chiari malformation type 1 | 57 % |
Chiari malformation type 2 | 1.5 % |
Basilar impression/invagination | 18–64 % |
Hydrocephalus | 3–23 % |
Tethered cord syndrome | 7 % |
Craniosynostosis | 0.7–17 % |
2.3.2 Post-traumatic Syringomyelia
The causes of spinal cord injury vary from country to country, depending on social and economic factors. Post-traumatic syringomyelia was previously thought to be an infrequent but serious sequel to such injuries, and clinical and CT studies suggested that it occurred with an incidence of between 1 and 5 % (Barnett et al. 1971; Biyani and El Masry 1994; El Masry and Biyani 1996). Since the introduction of MRI, the reported radiological incidence has increased up to 22 % (Burt 2004; Squier and Lehr 1994), which is consistent with the frequency of 17–20 % identified in post-mortem studies (Squier and Lehr 1994; Wozniewicz et al. 1983). Cystic necrosis of the spinal cord, confined to the level of injury, is generally considered to be a myelomalacic cavity and not syringomyelia, but asymptomatic cavitations, extending above and below the levels of injury, are often detected radiologically in victims of spinal cord injury, and these outnumber cases of symptomatic post-traumatic syringomyelia. Which asymptomatic cavities are likely to become symptomatic and over what length of time is, however, unknown. Progression may depend upon the original mechanism of injury or a variety of conditions inherent to the individual or both (Byun et al. 2010; Ohtonari et al. 2009).
Males are more likely to be victims of spinal cord injury than are females, in a ratio of about 6:1 (Burt 2004; El Masry and Biyani 1996). The interval between injury and diagnosis ranges from 2 months to 34 years (Biyani and El Masry 1994; El Masry and Biyani 1996). Full neurological recovery following the original spinal cord injury does not eliminate the possibility of post-traumatic syringomyelia developing later.
2.3.3 Syringomyelia in Patients with Non-traumatic Arachnoiditis
Syringomyelia is a rare sequel (less than 1 %) of infectious and non-infectious central nervous system inflammatory disease (Williams 1995). There are two main mechanisms by which inflammation may lead to the formation of syringomyelia: arachnoiditis and myelitis . Infection may also be a factor precipitating the onset of symptoms in Chiari-associated syringomyelia, in up to 7 % of patients (Milhorat et al. 1999).
Primary spinal syringomyelia is commonly secondary to post-inflammatory scarring, which leads to obstruction to the normal spinal CSF flow. Arachnoiditis might also cause syrinx formation by causing obliteration of the spinal microvasculature, leading to local cord ischaemia. Patterns of arachnoiditis seen range from focal meningeal cicatrix formation to diffuse adhesive spinal arachnoiditis (Caplan et al. 1990).
Foramen magnum arachnoiditis, in the absence of Chiari malformations, is a rare cause of syringomyelia (Klekamp et al. 2002). The mean interval between the presumed causative event (meningitis or trauma) and the development of syringomyelia-related symptoms can be up to 10 years. Compared with patients with Chiari malformation type 1, individuals with syringomyelia due to foramen magnum arachnoiditis have a much poorer long-term outcome. A stable clinical course was demonstrated in only 14 % of patients in whom surgery was not performed. Following surgery, 57 % of patients will have recurrence of symptoms within 5 years of the procedure.
Related posts:

Stay updated, free articles. Join our Telegram channel

Full access? Get Clinical Tree


