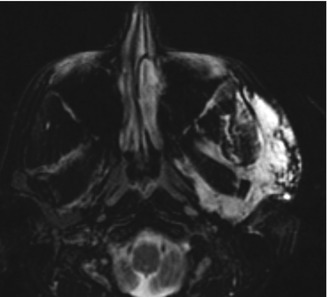
Fig. 45.1
Bio-Alcamid. Axial T1-weighted (a) and T2-weighted (b) MR images show T1 hypointense and T2 hyperintense lobulated material within the subcutaneous tissues of the bilateral cheeks (arrows)
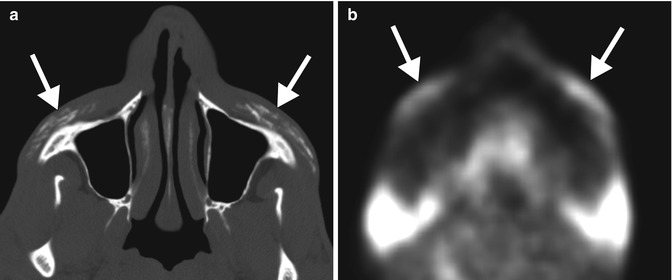
Fig. 45.2
Calcium hydroxyapatite (Radiesse). Axial CT image (a) shows patchy hyperattenuation fillers within the bilateral malar subcutaneous tissues (arrows). Axial 18FDG-PET image (b) shows corresponding hypermetabolism at the site of the fillers (arrows)
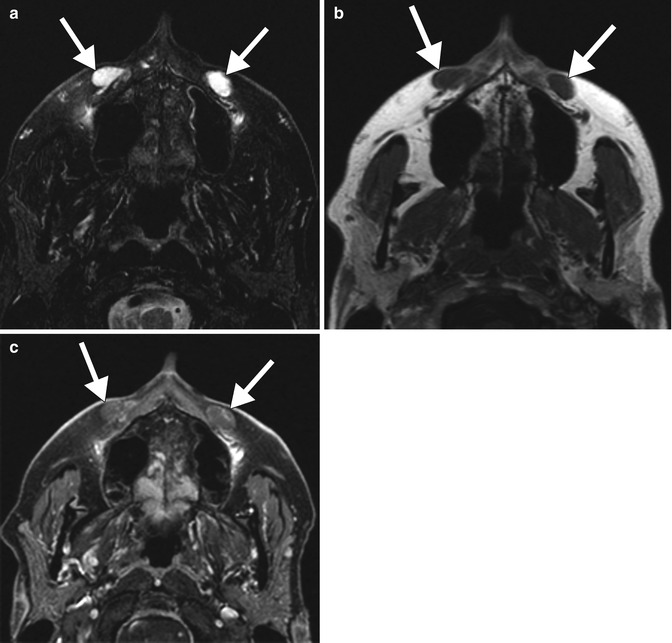
Fig. 45.3
Hyaluronic acid (Restylane). Axial fat-suppressed T2-weighted (a), T1-weighted (b), and fat-suppressed post-contrast T1-weighted (c) MR images show the filler within the bilateral nasolabial folds (arrows). The fillers demonstrate signal characteristics similar to fluid and minimal peripheral enhancement
Fig. 45.4
Hyaluronic acid (Juvederm). Axial CT with a region of interest marker shows that the perioral filler is of fluid attenuation
Fig. 45.5
Silicone oil. Axial CT image shows a rim calcified nodule in the subcutaneous tissues in a patient who received silicone injections many years before (arrow)
45.4 Differential Diagnosis
A variety of conditions can potentially resemble facial fillers on imaging:
Skin and vascular calcifications: Punctate dystrophic skin calcifications in the cheeks are commonly encountered on CT (Fig. 45.6). These can be rather numerous, but are of little clinical significance. Occasionally vascular calcifications form along the facial artery, particularly in diabetic patients. These can be distinguished from calcium hydroxyapatite facial fillers by their distribution and at times branching tubular configuration.
Fig. 45.6
Dystrophic skin calcifications. Axial CT image shows multiple punctuate calcifications in the skin of the bilateral cheeks
Lymphatic malformations: These are congenital vascular malformations that appear as trans-spatial masses that can involve the subcutaneous tissues of the face. Venous predominant lesions are typically T2 hyperintense, may have fluid levels, demonstrate enhancement (Fig. 45.7), and may contain phleboliths.